Building a bitcoin controller for Kubernetes part VII – testing

Kubernetes controllers are tightly integrated with the Kubernetes API – they are invoked if the state of the cluster changes, and they act by invoking the API in turn. This tight dependency turns testing into a challenge, and we need a smart testing strategy to be able to run unit and integration tests efficiently.

The Go testing framework

As a starting point, let us recall some facts about the standard Go testing framework and see what this means for the organization of our code.

A Go standard installation comes with the package testing which provides some basic functions to define and execute unit tests. When using this framework, a unit test is a function with a signature

func TestXXX(t *testing.T)

where XXX is the name of your testcase (which, ideally, should of course reflect the purpose of the test). Once defined, you can easily run all your tests with the command

$ go test ./...

from the top-level directory of your project. This command will scan all packages for functions following this naming convention and invoke each of the test functions. Within each function, you can use the testing.T object that can be used to indicate failure and log error messages. At the end of a test execution, a short summary of passed and failed tests will be printed.

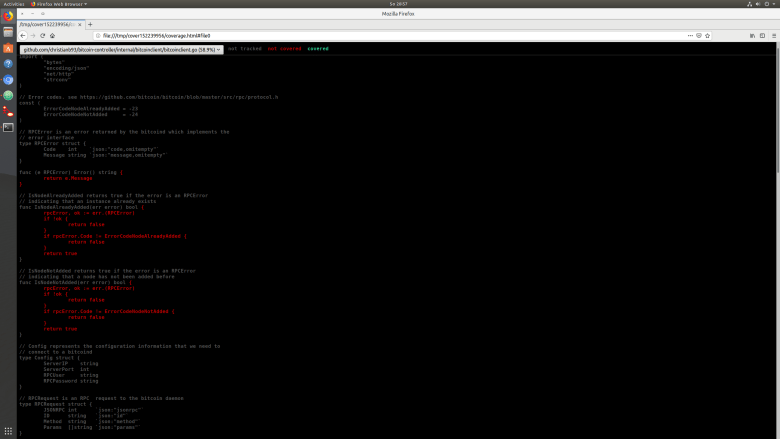
It is also possible to use go test to create and display a coverage analysis. To do this, run

$ go test ./... -coverprofile /tmp/cp.out
$ go tool cover -html=/tmp/cp.out

The first command will execute the tests and write coverage information into /tmp/cp.out. The second command will turn the contents of this file into HTML output and display this nicely in a browser, resulting in a layout as below (and yes, I understand that test coverage is a flawed metric, but still it is useful….)

GoTestCoverage

How do we utilize this framework in our controller framework? First, we have to decide in which packages we place the test functions. The Go documentation recommends to place the test code in the same package as the code under test, but I am not a big fan of this approach, because this will allow you to access private methods and attributes of the objects under test and not to test against contracts, but against implementation. Therefore I have decided to put the code for unit testing a package XYZ into a dedicated package XYZ_test (more on integration tests below).

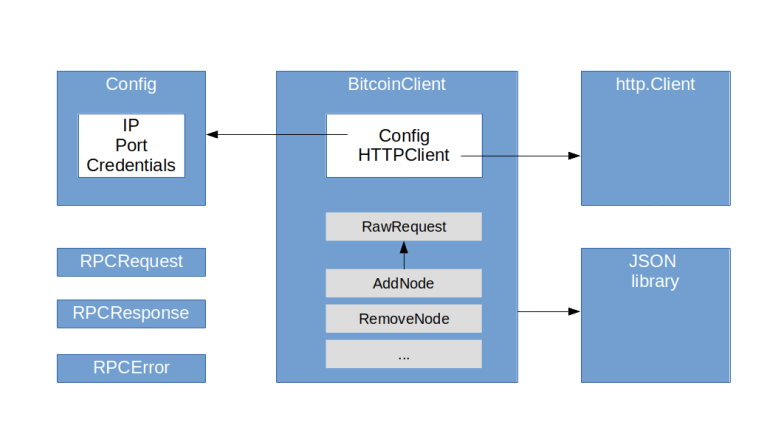
This approach has its advantages, but requires that you take testability into account when designing your code (which, of course, is a good idea anyway). In particular, it is good practice to use interfaces to allow for injection of test code. Let us take the code for the bitcoin RPC client as an example. Here, we use an interface HTTPClient to model the dependency of the RPC client from a HTTP clent. This interface is implemented by the client from the HTTP package, but for testing purposes, we can use a mock implementation and inject it when creating a bitcoin RPC client.

We also have to think about separation of unit tests which will typically use mock objects from integration tests that require a running Kubernetes cluster or a bitcoin daemon. There are different ways to do this, but the approach that I have chosen is as follows.

  • Unit tests are placed in the same directory as the code that they test
  • A unit test functions has a name that ends with “Unit”
  • Integration tests – which typically test the system as a whole and thus are not clearly linked to an individual package – are placed in a global subdirectory test
  • Integration test function names end on “Integration”

With this approach, we can run all unit tests by executing

go test ./... -run "Unit"

from the top-level directory, and can use the command

go test -run "Integration"

from within the test directory to run all integration tests.

The Kubernetes testing package

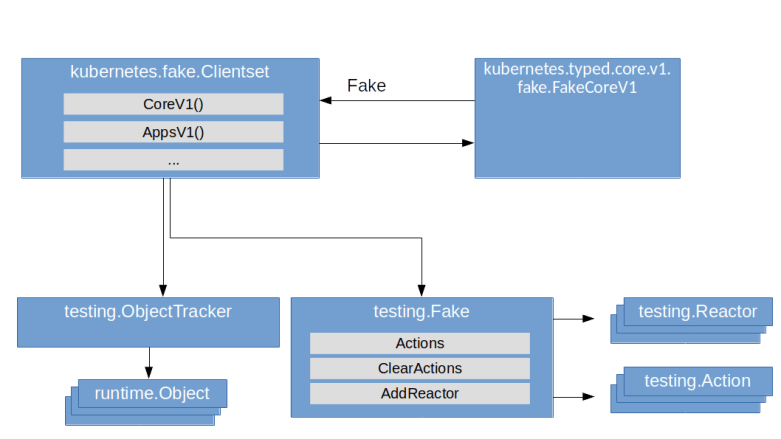
To run useful unit tests in our context, we typically need to simulate access to a Kubernetes API. We could of course our own mock objects, but fortunately, the Kubernetes client go package comes with a set of ready-to-use helper objects to do this. The core of this is the package client-go/testing. The key objects and concepts used in this package are

  • An action describes an API call, i.e. a HTTP request against the Kubernetes API, by defining the namespace, the HTTP verb and the resource and subresource that is addressed
  • A Reactor describes how a mock object should react to a particular action. We can ask a Reactor whether it is ready to handle a specific action and then invoke its React action to actually do this
  • A Fake object is essentially a collection of actions recording the actions that have been taken on the mock object and reactors that react upon these actions. The core of the Fake object is its Invoke method. This method will first record the action and then walk the registered reactors, invoking the first reactor that indicates that it will handle this action and returning its result

This is of course rather a framework than a functional mock object, but the client-go library offers more – it has a generated set of fake client objects that build on this logic. In fact, there is a fake clientset in the package client-go/kubernetes/fake which implements the kubernetes.Interface interface that makes up a Kubernetes API client. If you take a look at the source code, you will find that the implementation is rather straightforward – a fake clientset embeds a testing.Fake object and a testing.ObjectTracker which is essentially a simple object store. To link those two elements, it installs reactors for the various HTTP verbs like GET, UPDATE, … that simply carry out the respective action on the object tracker. When you ask such a fake clientset for, say, a Nodes object, you will receive an object that delegates the various methods like Get to the invoke method of the underlying fake object which in turn uses the reactors to get the result from the object tracker. And, of course, you can add your own reactors to simulate more specific responses.

KubernetesTesting

Using the Kubernetes testing package to test our bitcoin controller

Let us now discuss how we can use that testing infrastructure provided by the Kubernetes packages to test our bitcoin controller. To operate our controller, we will need the following objects.

  • Two clientsets – one for the standard Kubernetes API and one for our custom API – here we can utilize the machinery described above. Note that the Kubernetes code generators that we use also creates a fake clientset for our bitcoin API
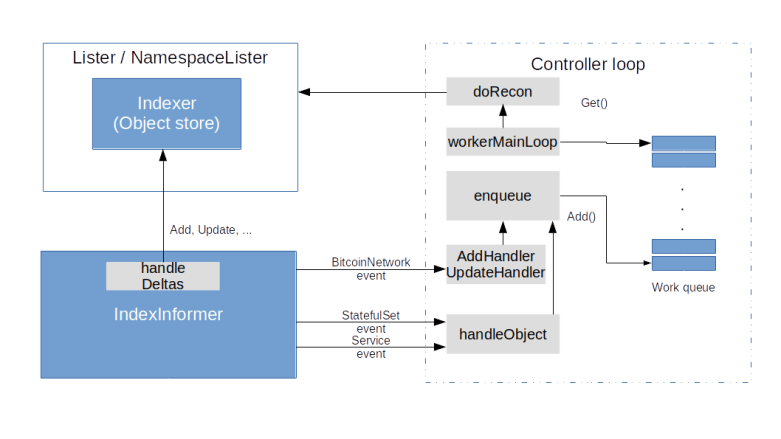
  • Informer factories – again there will be two factories, one for the Kubernetes API and one for our custom API. In a fully integrated environment these informers would invoke the event handlers of the controller and maintain the cache. In our setup, we do not actually run the controller, but only use the cache that they contain, and maintain the cache ourselves. This gives us more control about the contents of the cache, the timing and the invocations of the event handlers.
  • A fake bitcoin client that we inject into the controller to simulate the bitcoin RPC server

Its turns out to be useful to collect all components that make up this test bed in a Go structure testFixture. We can then implement some recurring functionality like the basic setup or starting and stopping the controller as methods of this object.

TestFixture

In this approach, there is a couple of pitfalls. First, it is important to keep the informer caches and the state stored in the fake client objects in sync. If, for example, we let the controller add a new stateful set, it will do this via the API, i.e. in the fake clientset, and we need to push this stateful set into the cache so that during the next iteration, the controller can find it there.

Another challenge is that our controller uses go routines to do the actual work. Thus, whenever we invoke an event handler, we have to wait until the worker thread has picked up the resulting queued event before we can validate the results. We could do this by simply waiting for some time, however, this is of course not really reliable and can lead to long execution times. Instead, it is a better approach to add a method to the controller which allows us to wait until the controller internal queue is empty and makes the tests deterministic. Finally, it is good practice to put independent tests into independent functions, so that each unit test function starts from scratch and does not rely on the state left over by the previous function. This is especially important because go test will cache test results and therefore not necessarily execute all test cases every time we run the tests.

Integration testing

Integration testing does of course require a running Kubernetes cluster, ideally a cluster that can be brought up quickly and can be put into a defined state before each test run. There are several options to achieve this. Of course, you could make use of your preferred cloud provider to bring up a cluster automatically (see e.g. this post for instructions on how to do this in Python), run your tests, evaluate the results and delete the cluster again.

If you prefer a local execution, there are by now several good candidates for doing this. I have initially executed integration tests using minikube, but found that even though this does of course provide perfect isolation, it has the disadvantage that starting a new minikube cluster takes some time, which can slow down the integration tests considerably. I have therefore switched to kind which runs Kubernetes locally in a Docker container. With kind, a cluster can be started in approximately 30 seconds (depending, of course, on your machine). In addition, kind offers an easy way to pre-load docker images into the nodes, so that no download from Docker hub is needed (which can be very slow). With kind, the choreography of a integration test run is roughly as follows.

  • Bring up a local bitcoin daemon in Docker which will be used to test the Bitcoin RPC client which is part of the bitcoin controller
  • Bring up a local Kubernetes cluster using kind
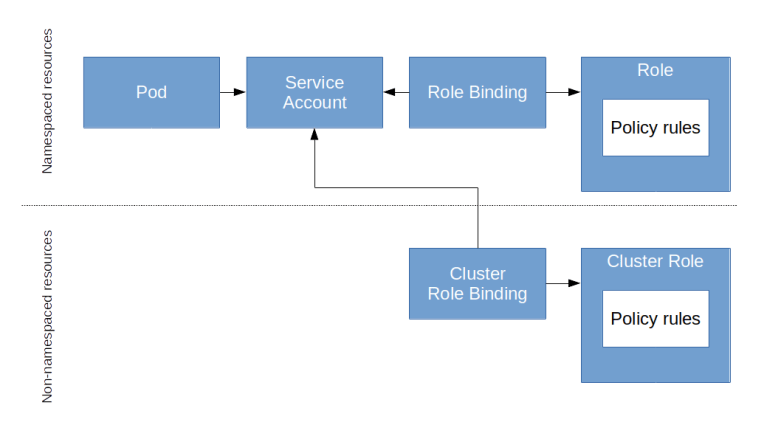
  • Install the bitcoin network CRD, the RBAC profile and the default secret
  • Build the bitcoin controller and a new Docker image and tag it in the local Docker repository
  • Pre-load the image into the nodes
  • Start a pod running the controller
  • Pre-pull the docker image for the bitcoin daemon
  • Run the integration tests using go test
  • Tear down the cluster and the bitcoin daemon again

I have created a shell script that runs these steps automatically. Currently, going through all these steps takes about two minutes (where roughly 90 seconds are needed for the actual tests and 30 seconds for setup and tear-down). For the future, I plan to add support for microk8s as well. Of course, this could be automated further using a CI/CD pipeline like Jenkins or Travis CI, with proper error handling, a clean re-build from a freshly cloned repo and more reporting functionality – this is a topic that I plan to pick up in a later post.

Building a bitcoin controller for Kubernetes part V – establishing connectivity

Our bitcoin controller now has the basic functionality that we expect – it can synchronize the to-be state and the as-is state and update status information. However, to be really useful, a few things are still missing. Most importantly, we want our nodes to form a real network and need to establish a mechanism to make them known to each other. Specifically, we will use RPC calls to exchange IP addresses between the nodes in our network so that they can connect.

Step 10: talking to the bitcoin daemon

To talk to the bitcoin daemon, we will use its JSON RPC interface. We thus need to be able to send and receive HTTP POST requests and to serialize and de-serialize JSON. Of course there are some libraries out there that could do this for us, but it is much more fun to implement our own bitcoin client in Go. For that purpose, we will use the packages HTTP and JSON.

While developing this client, it is extremely useful to have a locally running bitcoind. As we already have a docker image, this is very easy – simply run

$ docker run -d -p 18332:18332 christianb93/bitcoind

on your local machine (assuming you have Docker installed). This will open port 18332 which you can access using for instance curl, like

$ curl --user 'user:password' --data '{"jsonrpc":"1.0","id":"0","method":"getnetworkinfo","params":[]}' -H 'content-type:text/plain;' http://localhost:18332

Our client will be very simple. Essentially, it consists of the following two objects.

  • A Config represents the configuration data needed to access an RPC server (IP, port, credentials)
  • A BitcoinClient which is the actual interface to the bitcoin daemon and executes RPC calls

A bitcoin client holds a reference to a configuration which is used as default if no other configuration is supplied, and a HTTP client. Its main method is RawRequest which creates an RPC request, adds credentials and parses the response. No error handling to e.g. deal with timeouts is currently in place (this should not be a real restriction in practice, as we have the option to re-queue our processing anyway). In addition to this generic function which can invoke any RPC method, there are specific functions like AddNode, RemoveNode and GetAddedNodeList that accept and return Go structures instead of JSON objects. In addition, there are some structures to model RPC request, RPC responses and errors.

BitcoinClient

Node that our controller now needs to run inside the cluster, as it needs to access the bitcoind RPC servers (there might be ways around this, for instance by adding a route on the host similar to what minikube tunnel is doing for services, but I found that this is easily leads to IP range conflicts with e.g. Docker).

Step 11: adding new nodes to our network

When we bring up a network of bitcoin nodes, each node starts individually, but is not connected to any other node in the network – in fact, if we bring up three nodes, we maintain three isolated blockchains. For most use cases, this is of course not what we want. So let us now try to connect the nodes to each other.

To do this, we will manipulate the addnode list that each bitcoind maintains. This list is like a database of known nodes to which the bitcoind will try to connect. Before we automate this process, let us first try this out manually. Bring up the network and enter

$ ip1=$(kubectl get bitcoinnetwork my-network -o json | jq -r ".status.nodes[1].ip")
$ kubectl exec my-network-sts-0 -- /usr/local/bin/bitcoin-cli -regtest -conf=/bitcoin.conf addnode $ip1 add

This will find out the (node) IP address of the second node using our recently implemented status information and invoke the JSON-RPC method addnode on the first node to connect the first and the second node. We can now verify that the IP address of node 1 has been added to the addnode list of node 0 and that node 1 has been added to the peer list of node 0, but also node 0 has been added to the peer list of node 1.

$ kubectl exec my-network-sts-0 -- /usr/local/bin/bitcoin-cli -regtest -conf=/bitcoin.conf getaddednodeinfo
$ kubectl exec my-network-sts-0 -- /usr/local/bin/bitcoin-cli -regtest -conf=/bitcoin.conf getpeerinfo
$ kubectl exec my-network-sts-1 -- /usr/local/bin/bitcoin-cli -regtest -conf=/bitcoin.conf getpeerinfo

We can now repeat this process with the third node – we again make the node known to node 0 and then get the list of nodes each nodes knows about.

$ ip2=$(kubectl get bitcoinnetwork my-network -o json | jq -r ".status.nodes[2].ip")
$ kubectl exec my-network-sts-0 -- /usr/local/bin/bitcoin-cli -regtest -conf=/bitcoin.conf addnode $ip2 add
$ kubectl exec my-network-sts-0 -- /usr/local/bin/bitcoin-cli -regtest -conf=/bitcoin.conf getpeerinfo
$ kubectl exec my-network-sts-1 -- /usr/local/bin/bitcoin-cli -regtest -conf=/bitcoin.conf getpeerinfo
$ kubectl exec my-network-sts-2 -- /usr/local/bin/bitcoin-cli -regtest -conf=/bitcoin.conf getpeerinfo

We see that

  • Node 0 knows both node 1 and node 2
  • Node 1 knows only node 0
  • Node 2 knows only node 1

So in contrast to my previous understanding, the nodes do not automatically connect to each other when there is a node that is known to all of them. After some research, I suspect that this is because bitcoind puts addresses into buckets and only connects to one IP address in the bucket. As IP addresses in the same subnet go into the same bucket, only one connection will be made by default. To avoid an artificial dependency on node 0, we therefore explicitly connect each node to any other node in the network.

To do this, we create an additional function syncNodes which is called during the reconciliation if we detect a change in the node list. Within this function, we then simply loop over all nodes that are ready and, for each node:

  • Submit the RPC call addednodeinfo to get a list of all nodes that have previously been added
  • For each node that is not in the list, add it using the RPC call addnode with command add
  • For each node that is in the list, but is no longer ready, use the same RPC call with command remove to remove it from the list

As there might be another worker thread working on the same network, we ignore, for instance, errors that a bitcoind returns when we try to add a node that has already been added before, similarly for deletions.

Time again to run some tests. First, let us run the controller and bring up a bitcoin network called my-network (assuming that you have cloned my repository)

$ kubectl apply -f deployments/controller.yaml
$ kubectl apply -f deployments/testNetwork.yaml

Wait for some time – somewhere between 30 and 45 seconds – to allow all nodes to come up. Then, inspect the log file of the controller

$ kubectl logs bitcoin-controller -n bitcoin-controller

You should now see a few messages indicating that the controller has determined that nodes need to be added to the network. To verify that this worked, we can print all added node lists for all three instances.

$ for i in {0..2}; 
do
  ip=$(kubectl get pod my-network-sts-$i -o json  | jq -r ".status.podIP")
  echo "Connectivity information for node $i (IP $ip):" 
  kubectl exec my-network-sts-$i -- /usr/local/bin/bitcoin-cli -regtest -conf=/bitcoin.conf getaddednodeinfo | jq -r ".[].addednode"
done

This should show you that in fact, all nodes are connected to each other – each node is connected to all other nodes. Now let us connect to one node, say node 0, and mine a few blocks.

$ kubectl exec my-network-sts-0 -- /usr/local/bin/bitcoin-cli -regtest -conf=/bitcoin.conf generate 101

After a few seconds, we can verify that all nodes have synchronized the chain.

$ for i in {0..2}; 
do
  ip=$(kubectl get pod my-network-sts-$i -o json  | jq -r ".status.podIP")
  blocks=$(kubectl exec my-network-sts-$i -- /usr/local/bin/bitcoin-cli -regtest -conf=/bitcoin.conf getblockchaininfo | jq -r ".blocks")
  echo "Node $i (IP $ip) has $blocks blocks" 
done

This should show you that all three nodes have 101 blocks in their respective chain. What happens if we bring down a node? Let us delete, for instance, pod 0.

$ kubectl delete pod my-network-sts-0

After a few seconds, the stateful set controller will have brought up a replacement. If you wait for a few more seconds and repeat the command above, you will see that the new node has been integrated into the network and synchronized the blockchain. In the logfiles of the controller, you will also see that two things have happened (depending a bit on timing). First, the controller has realized that the node is no longer ready and uses RPC calls to remove it from the added node lists of the other nodes. Second, when the replacement node comes up, it will add this node to the remaining nodes and vice versa, so that the synchronization can take place.

Similarly, we can scale our deployment. To do this, enter

$ kubectl edit bitcoinnetwork my-network

Then change the number of replicas to four and save the file. After a few seconds, we can inspect the state of the blockchain on the new node and find that is also has 101 blocks.

$ kubectl exec my-network-sts-3 -- /usr/local/bin/bitcoin-cli -regtest -conf=/bitcoin.conf getblockchaininfo

Again, the log files of the controller tell us that the controller has detected the new node and added it to all other nodes. Similarly, if we use the same procedure to scale down again, the nodes that are removed from the stateful set will also be removed from the added node lists of the remaining nodes.

We now have the core functionality of our controller in place. As in the previous posts, I have pushed the code into a new tag on GitHub. I have also pushed the latest image to Docker Hub so that you can repeat the tests described above without building the image yourself. In the next post, we will start to add some more meat to our controller and to implement some obvious improvements – proper handling of secrets, for instance.

Building a bitcoin controller for Kubernetes part IV – garbage collection and status updates

In our short series on implementing a bitcoin controller for Kubernetes, we have reached the point where the controller is actually bringing up bitcoin nodes in our network. Today, we will extend its logic to also cover deletions and we will start to add additional logic to monitor the state of our network.

Step 9: owner references and deletions

As already mentioned in the last post, Kubernetes has a built-in garbage collector which we can utilize to handle deletions so that our controller does not have to care about this.

The Kubernetes garbage collector is essentially a mechanism that is able to perform cascading deletes. Let us take a deployment as an example. When you create a deployment, the deployment will in turn create a replica set, and the replica set will bring up pods. When you delete the deployment, the garbage collector will make sure that the replica set is deleted, and the deletion of the replica set in turn will trigger the deletion of the pods. Thus we only have to maintain the top-level object of the hierarchy and the garbage collector will help us to clean up the dependent objects.

The order in which objects are deleted is controller by the propagation policy which can be selected when deleting an object. If “Foreground” is chosen, Kubernetes will mark the object as pending deletion by setting its deletionTimestamp and delete all objects that are owned by this object in the background before itself is eventually removed. For a “Background” deletion, the order is reversed – the object will be deleted right away, and the cleanup will be performed afterwards.

How does the garbage collector identify the objects that need to be deleted when we delete, say, a deployment? The ownership relation underlying this logic is captured by the ownership references in the object metadata. This structure contains all the information (API version, kind, name, UID) that Kubernetes needs to identify the owner of an object. An owner reference can conveniently be generated using the function NewControllerRef in the package k8s.io/apimachinery/pkg/apis/meta/v1

Thus, to allow Kubernetes to clean up our stateful set and the service when we delete a bitcoin network, we need to make two changes to our code.

  • We need to make sure that we add the owner reference to the metadata of the objects that we create
  • When reconciling the status of a bitcoin network with its specification, we should ignore networks for which the deletion timestamp is already set, otherwise we would recreate the stateful set while the deletion is in progress

For the sake of simplicity, we can also remove the delete handler from our code completely as it will not trigger any action anyway. When you now repeat the tests at the end of the last post and delete the bitcoin, you will see that the stateful set, the service and the pods are deleted as well.

At this point, let us also implement an additional improvement. When a service or a stateful set changes, we have so far been relying on the periodic resynchronisation of the cache. To avoid long synchronization times, we can also add additional handlers to our code to detect changes to our stateful set and our headless service. To distinguish changes that affect our bitcoin networks from other changes, we can again use the owner reference mechanism, i.e. we can retrieve the owner reference from the stateful set to figure out to which – if any – bitcoin network the stateful set belongs. Following the design of the sample controller, we can put this functionality into a generic method handleObject that works for all objects.

BitcoinControllerStructureII

Strictly speaking, we do not really react upon changes of the headless service at the moment as the reconciliation routine only checks that it exists, but not its properties, so changes to the headless service would go undetected at the moment. However, we add the event handler infrastructure for the sake of completeness.

Step 10: updating the status

Let us now try to add some status information to our bitcoin network which is updated regularly by the controller. As some of the status information that we are aiming at is not visible to Kubernetes (like the synchronization state of the blockchain), we will not add additional watches to capture for instance the pod status, but once more rely on the periodic updates that we do anyway.

The first step is to extend the API type that represents a bitcoin network to add some more status information. So let us add a list of nodes to our status. Each individual node is described by the following structure

type BitcoinNetworkNode struct {
	// a number from 0...n-1 in a deployment with n nodes, corresponding to
	// the ordinal in the stateful set
	Ordinal int32 `json:"ordinal"`
	// is this node ready, i.e. is the bitcoind RPC server ready to accept requests?
	Ready bool `json:"ready"`
	// the IP of the node, i.e. the IP of the pod running the node
	IP string `json:"ip"`
	// the name of the node
	NodeName string `json:"nodeName"`
	// the DNS name
	DNSName string `json:"dnsName"`
}

Correspondingly, we also need to update our definition of a BitcoinNetworkStatus – do not forget to re-run the code generation once this has been done.

type BitcoinNetworkStatus struct {
	Nodes []BitcoinNetworkNode `json:"nodes"`
}

The next question we have to clarify is how we determine the readiness of a bitcoin node. We want a node to appear as ready if the bitcoind representing the node is accepting JSON RPC requests. To achieve this, there is again a Kubernetes mechanism which we can utilize – readiness probes. In general, readiness probes can be defined by executing an arbitrary command or by running a HTTP request. As we are watching a server object, using HTTP requests seems to be the way to go, but there is a little challenge: the bitcoind RPC server uses HTTP POST requests, so we cannot use a HTTP GET request as a readiness probe, and Kubernetes does not allow us to configure a POST request. Instead, we use the exec-option of a readiness check and run the bitcoin CLI inside the container to determine when the node is ready. Specifically, we execute the command

/usr/local/bin/bitcoin-cli -regtest -conf=/bitcoin.conf getnetworkinfo

Here we use the configuration file that contains, among other things, the user credentials that the CLI will use. As a YAML structure, this readiness probe would be set up as follows (but of course we do this in Go in our controller programmatically).

   readinessProbe:
      exec:
        command:
        - /usr/local/bin/bitcoin-cli
        - -regtest
        - -conf=/bitcoin.conf
        - getnetworkinfo
      failureThreshold: 3
      initialDelaySeconds: 10
      periodSeconds: 10
      successThreshold: 1
      timeoutSeconds: 1

Note that we wait 10 seconds before doing the first probe, to give the bitcoind sufficient time to come up. It is instructive to test higher values of this, for instance 60 seconds – when the stateful set is created, you will see how the creation of the second pod is delayed for 60 seconds until the first readiness check for the first pod succeeds.

Now let us see how we can populate the status structure. Basically, we need to retrieve a list of all pods that belong to our bitcoin network. We could of course again use the ownership references to find those pods, or use the labels that we need anyway to define our stateful set. But in our case, there is even a an easier approach – as we use a stateful set, the names of the pods are completely predictable and we can easily retrieve them all by name. So to update the status information, we need to

  • Loop through the pods controlled by this stateful set, and for each pod
  • Find the status of the pod, using its conditions
  • Retrieve the pods IP address from its status
  • Assemble the DNS name (which, as we know, is the combination of the name of the pod and the name of the headless service)
  • Put all this into the above structure
  • Post this using the UpdateStatus method of our client object

Note that at this point, we follow the recommended best practise and update the status independent of the spec. It is instructive to extend the logging of the controller to log the generation of the bitcoin network and the resourceVersion. The generation (contained in the ObjectMeta structure) represents a version of the desired state, i.e. the spec, and is only updated (usually incremented by one) if we change the spec for the bitcoin network resource. In contrast to this, the resource version is updated for every change of the persisted state of the object and represents the etcd’s internal sequence number.

When you try to run our updated controller inside the cluster, however, you will find that there is again a problem – with the profile that we have created and to which our service account is linked, the update of the status information of a bitcoin network is not allowed. Thus we have to explicitly allow this by granting the update right on the subresource status, which is done by adding the following rule to our cluster role.

- apiGroups: ["bitcoincontroller.christianb93.github.com"]
  resources: ["bitcoinnetworks/status"]
  verbs: ["update"] 

We can now run a few more tests to see that our status updates work. When we bring up a new bitcoin network and use kubectl with “-o json” to retrieve the status of the bitcoin network, we can see that the node list populates as the pods are brought up and the status of the nodes changes to “Ready” one by one.

I have again created a tag v0.4 in the GitHub repository for this series to persist the state of the code at this point in time, so that you have the chance to clone the code and play with it. In the next post, we will move on and add the code needed to make sure that our bitcoin nodes detect each other at startup and build a real bitcoin network.

Building a bitcoin controller for Kubernetes part III – service accounts and the reconciliation function

In the previous post, we have reached the point where our controller is up and running and is starting to handle events. However, we hit upon a problem at the end of the last post – when running in-cluster, our controller uses a service account which is not authorized to access our bitcoin network resources. In todays post, we will see how to fix this by adding RBAC rules to our service account. In addition, we will implement the creation of the actual stateful set when a new bitcoin network is created.

Step 7: defining a service account and roles

To define what a service account is allowed to do, Kubernetes offers an authorization scheme based on the idea of role-based access control (RBAC). In this model, we do not add authorizations to a user or service account directly. Instead, the model knows three basic entities.

  • Subjects are actors that need to be authorized. In Kubernetes, actors can either be actual users or service accounts.
  • Roles are collection of policy rules that define a set of allowed actions. For instance, there could be a role “reader” which allows read-access to all or some resources, and a separate role “writer” that allows write-access.
  • Finally, there are role bindings which link roles and subjects. A subject can have more than one role, and each role can be assigned to more than one subject. The sum of all roles assigned to a subject determines what this subject is allowed to do in the cluster

The actual data model is a bit more complicated, as there are some rules that only make sense on the cluster level, and other rules can be restricted to a namespace.

RBAC

How do we specify a policy rule? Essentially, a policy rule lists a set of resources (specified by the API group and the resource type or even specific resource names) as they would show up in an API path, and a set of verbs like GET, PUT etc. When we add a policy rule to a role, every subject that is linked to this role will be authorized to run API calls that match this combination of resource and verb.

A cluster role then basically consists of a list of policy rules (there is also a mechanism called aggregation which allows us to build hierarchies or roles). Being an API object, it can be described by a manifest file and created using kubectl as any other resource. So to set up a role that will allow our controller to list, get and update bitcoin network resources and pods and create, update, get, list and delete stateful sets, we would apply the following manifest file.

kind: ClusterRole
apiVersion: rbac.authorization.k8s.io/v1
metadata:
  name: bitcoin-controller-role
rules:
- apiGroups: ["apps", ""]
  resources: ["statefulsets", "services"]
  verbs: ["get", "watch", "list", "create", "update", "delete"]
- apiGroups: [""]
  resources: ["pods"]
  verbs: ["get", "list", "watch"]
- apiGroups: ["bitcoincontroller.christianb93.github.com"]
  resources: ["bitcoinnetworks"]
  verbs: ["get", "list", "watch"]

Next, we set up a specific service account for our controller (otherwise we would have to add our roles to the default service account which is used by all pods by default – this is not what we want). We need to do this for every namespace in which we want to run the bitcoin operator. Here is a manifest file that creates a new namespace bitcoin-controller with a corresponding service account.

apiVersion: v1
kind: Namespace
metadata:
    name: bitcoin-controller
---
apiVersion: v1
kind: ServiceAccount
metadata:
  name: bitcoin-controller-sva
  namespace: bitcoin-controller

Let us now link this service account and our cluster role by defining a cluster role binding. Again, a cluster role binding can be defined in a manifest file and be applied using kubectl.

apiVersion: rbac.authorization.k8s.io/v1
kind: ClusterRoleBinding
metadata:
  name: bitcoin-controller-role-binding
subjects:
- kind: ServiceAccount
  name: bitcoin-controller-sva
  namespace: bitcoin-controller
roleRef:
  kind: ClusterRole
  name: bitcoin-controller-role
  apiGroup: rbac.authorization.k8s.io

Finally, we need to modify our pod specification to instruct Kubernetes to run our controller using our newly created service account. This is easy, we just need to add the service account as a field to the Pod specification:

...
spec:
  serviceAccountName: bitcoin-controller-sva
...

When we now run our controller using the modified manifest file, it should be able to access all the objects it needs and the error messages observed at the end of our last post should disappear. Note that we need to run our controller in the newly created namespace bitcoin-controller, as our service account lives in this namespace. Thus you will have to create a service account and a cluster role binding for every namespace in which you want to run the bitcoin controller.

Step 8: creating stateful sets

Let us now start to fill the actual logic of our controller. The first thing that we will do is to make sure that a stateful set (and a matching headless service) is created when a new bitcoin network is defined and conversely, the stateful set is removed again when the bitcoin network is deleted.

This requires some additional fields in our controller object that we need to define and populate. We will need

  • access to indexers for services and stateful sets in order to efficiently query existing stateful sets and services, i.e. additional listers and informers (strictly speaking we will not need the informers in todays post, but in a future post – here we only need the listers)
  • A clientset that we can use to create services and stateful sets

Once we have this, we can design the actual reconciliation logic. This requires a few thoughts. Remember that our logic should be level-based and not edge-based, because our controller could actually miss events, for instance if it is down for some time and comes up again. So the logic that we implement is as follows and will be executed every time when we retrieve a trigger from the work queue.

Retrieve the headless service for this bitcoin network 
IF service does not exist THEN
  create new headless service
END IF
Retrieve the stateful set for this bitcoin network 
IF stateful set does not exist THEN
  create new stateful set
END IF
Compare number of nodes in bitcoin network spec with replicas in stateful set
IF they are not equal
  update stateful set object
END IF

For simplicity, we will use a naming convention to match bitcoin networks and stateful sets. This has the additional benefit that when we try to create a second stateful set by mistake, it will be refused as no two stateful sets with the same name can exist. Alternatively, we could use a randomly generated name and use labels or annotations to match stateful sets and controllers (and, of course, there are owner references – more on this below).

Those of you who have some experience with concurrency, multi-threading, locks and all this (for instance because you have built an SMP-capable operating system kernel) will be a bit alerted when looking at this code – it seems very vulnerable to race conditions. What if a node is just going down and the etcd does not know about it yet? What if the cache is stale and the status in the etcd is already reflecting updates that we do not see? What if two events are processed concurrently by different worker threads? What if a user updates the bitcoin network spec while we are just bringing up our stateful sets?

There are two fundamentally different ways to deal with these challenges. Theoretically, we could probably use the API mechanisms provided for optimistic locking ( resource versions that are being checked on updates) to implement basic synchronization primitives like compare-and-swap as it is done to implement leader election on Kubernetes, see also this blog. We could then implement locking mechanisms based on these primitives and use them to protect our resources. However, this will never be perfect, as there will always be a lag between the state in the etcd and the actual state of the cluster. In addition, this can easily put us in a situation where deadlocks occur or locks at least slow down the processing massively.

The second approach – which, looking at the source code of some controllers in the Kubernetes repositories, seems to be the approach taken by the K8s community – is to accept that full consistency will never be possible and to strive for eventual consistency. All actors in the system need to prepare for encountering temporary inconsistencies and implement mechanisms to deal with them, for instance be re-queuing events until the situation is resolved. This is the approach that we will also take for our controller. This implies, for instance, that we re-queue events when errors occur and that we leverage the periodic resync of the cache to reconcile the to-be state and the as-is state periodically. In this way, inconsistencies can arise but should be removed in the next synchronisation cycle.

In this version of the code, error handling is still very simple – most of the time, we simply stop the reconciliation when an error occurs without re-queuing the event and rely on the periodic update that happens every 30 seconds anyway because the cache is re-built. Of course there are errors for which we might want to immediately re-queue to retry faster, but we leave that optimization to a later version of the controller.

Let us now run a few tests. I have uploaded the code after adding all the features explained in this post as tag v3 to Github. For simplicity, I assume that you have cloned this code into the corresponding directory github.com/christianb93/bitcoin-controller in your Go workspace and have a fresh copy of a Minikube cluster. To build and deploy the controller, we have to add the CRD, the service account, cluster role and cluster role binding before we can build and deploy the actual image.

$ kubectl apply -f deployments/crd.yaml
$ kubectl apply -f deployments/rbac.yaml
$ ./build/controller/minikube_build.sh
$ kubectl apply -f deployments/controller.yaml

At this point, the controller should be up and running in the namespace bitcoin-controller, and you should be able to see its log output using

$ kubectl logs -n bitcoin-controller bitcoin-controller

Let us now add an actual bitcoin network with two replicas.

$ kubectl apply -f deployments/testNetwork.yaml

If you now take a look at the logfiles, you should see a couple of messages indicating that the controller has created a stateful set my-network-sts and a headless service my-network-svc. These objects have been created in the same namespace as the bitcoin network, i.e. the default namespace. You should be able to see them doing

$ kubectl get pods
$ kubectl get sts
$ kubectl get svc

When you run these tests for the first time in a new cluster, it will take some time for the containers to come up, as the bitcoind image has to be downloaded from the Docker Hub first. Once the pods are up, we can verify that the bitcoin daemon is running, say on the first node

$ kubectl exec my-network-sts-0 -- /usr/local/bin/bitcoin-cli -regtest -rpcuser=user -rpcpassword=password getnetworkinfo

We can also check that our controller will monitor the number of replicas in the stateful set and adjust accordingly. When we set the number of replicas in the stateful set to five, for instance, using

$ kubectl scale --replicas=5 statefulset/my-network-sts

and then immediately list the stateful set, you will see that the stateful set will bring up additional instances. After a few seconds, however, when the next regular update happens, the controller will detect the difference and scale the replica set down again.

This is nice, but there is again a problem which becomes apparent if we delete the network again.

$ kubectl delete bitcoinnetwork my-network

As we can see in the logs, this will call the delete handler, but at this point in time, the handler is not doing anything. Should we clean up all the objects that we have created? And how would that fit into the idea of a level based processing? If the next reconciliation takes place after the deletion, how can we identify the remaining objects?

Fortunately, Kubernetes offers very general mechanisms – owner references and cascading deletes – to handle these problems. In fact, Kubernetes will do all the work for us if we only keep a few points in mind – this will be the topic of the next post.

Building a bitcoin controller for Kubernetes part I – the basics

As announced in a previous post, we will, in this and the following posts, implement a bitcoin controller for Kubernetes. This controller will be aimed at starting and operating a bitcoin test network and is not designed for production use.

Here are some key points of the design:

  • A bitcoin network will be specified by using a custom resource
  • This definition will contain the number of bitcoin nodes that the controller will bring up. The controller will also talk to the individual bitcoin daemons using the Bitcon JSON RPC API to make the nodes known to each other
  • The controller will monitor the state of the network and maintain a node list which is part of the status subresource of the CRD
  • The bitcoin nodes are treated as stateful pods (i.e. controlled by a stateful set), but we will use ephemeral storage for the sake of simplicity
  • The individual nodes are not exposed to the outside world, and users running tests against the cluster either have to use tunnels or log into the pod to run tests there – this is of course something that could be changed in a future version

The primary goal of writing this operator was not to actually run it in real uses cases, but to demonstrate how Kubernetes controllers work under the hood… Along the way, we will learn a bit about building a bitcoin RPC client in Go, setting up and using service accounts with Kubernetes, managing secrets, using and publishing events and a few other things from the Kubernetes / Go universe.

Step 1: build the bitcoin Docker image

Our controller will need a Docker image that contains the actual bitcoin daemon. At least initially, we will use the image from one of my previous posts that I have published on the Docker Hub. If you decide to use this image, you can skip this section. If, however, you have your own Docker Hub account and want to build the image yourself, here is what you need to do.

Of course, you will first need to log into Docker Hub and create a new public repository.
You will also need to make sure that you have a local version of Docker up and running. Then follow the instructions below, replacing christianb93 in all but the first lines with your Docker Hub username. This will

  • Clone my repository containing the Dockerfile
  • Trigger the build and store the resulting image locally, using the tag username/bitcoind:latest – be patient, the build can take some time
  • Log in to the Docker hub which will store your credentials locally for later use by the docker command
  • Push the tagged image to the Docker Hub
  • Delete your credentials again
$ git clone https://github.com/christianb93/bitcoin.git
$ cd bitcoin/docker 
$ docker build --rm -f Dockerfile -t christianb93/bitcoind:latest .
$ docker login
$ docker push christianb93/bitcoind:latest
$ docker logout

Step 2: setting up the skeleton – logging and authentication

We are now ready to create a skeleton for our controller that is able to start up inside a Kubernetes cluster and (for debugging purposes) locally. First, let us discuss how we package our code in a container and run it for testing purposes in our cluster.

The first thing that we need to define is our directory layout. Following standard conventions, we will place our code in the local workspace, i.e. the $GOPATH directory, under $GOPATH/src/github.com/christianb93/bitcoin-controller. This directory will contain the following subdirectories.

  • internal will contain our packages as they are not meant to be used outside of our project
  • cmd/controller will contain the main routine for the controller
  • build will contain the scripts and Dockerfiles to build everything
  • deployments will holds all manifest files needed for the deployment

By default, Go images are statically linked against all Go specific libraries. This implies that you can run a Go image in a very minimal container that contains only C runtime libraries. But we can go even further and ask the Go compiler to also statically link the C runtime library into the Go executable. This executable is then independent of any other libraries and can therefore run in a “scratch” container, i.e. an empty container. To compile our controller accordingly, we can use the commands

CGO_ENABLED=0 go build
docker build --rm -f ../../build/controller/Dockerfile -t christianb93/bitcoin-controller:latest .

in the directory cmd/controller. This will build the controller and a docker image based on the empty scratch image. The Dockerfile is actually very simple:

FROM scratch

#
# Copy the controller binary from the context into our
# container image
#
COPY controller /
#
# Start controller
#
ENTRYPOINT ["/controller"]

Let us now see how we can run our controller inside a test cluster. I use minikube to run tests locally. The easiest way to run own images in minikube is to build them against the docker instance running within minikube. To do this, execute the command

eval $(minikube docker-env)

This will set some environment variables so that any future docker commands are directed to the docker engine built into minikube. If we now build the image as above, this will create a docker image in the local repository. We can run our image from there using

kubectl run bitcoin-controller --image=christianb93/bitcoin-controller --image-pull-policy=Never --restart=Never

Note the image pull policy – without this option, Kubernetes would try to pull the image from the Docker hub. If you do not use minikube, you will have to extend the build process by pushing the image to a public repository like Docker hub or a local repository reachable from within the Kubernetes cluster that you use for your tests and omit the image pull policy flag in the command above. We can now inspect the log files that our controller writes using

kubectl logs bitcoin-controller

To implement logging, we use the klog package. This will write our log message to the standard output of the container, where they are picked up by the Docker daemon and forwarded to the Kubernetes logging system.

Our controller will need access to the Kubernetes API, regardless of whether we execute it locally or within a Kubernetes cluster. For that purpose, we use a command-line argument kubeconfig. If this argument is set, it refers to a kubectl config file that is used by the controller. We then follow the usual procedure to create a clientset.

In case we are running inside a cluster, we need to use a different mechanism to obtain a configuration. This mechanism is based on a service accounts.

Essentially, service accounts are “users” that are associated with a pod. When we associate a service account with a pod, Kubernetes will map the credentials that authenticate this service account into /var/run/secrets/kubernetes.io/serviceaccount. When we use the helper function clientcmd.BuildConfigFromFlags and pass an empty string as configuration file, the Go client will fall back to in-cluster configuration and try to retrieve the credentials from that location. If we do not specify a service account for the pod, a default account is used. This is what we will do for the time being, but we will soon run into trouble with this approach and will have to define a service account, an RBAC role and a role binding to grant permissions to our controller.

Step 3: create a CRD

Next, let us create a custom resource definition that describes our bitcoin network. This definition is very simple – the only property of our network that we want to make configurable at this point in time is the number of bitcoin nodes that we want to run. We do specify a status subresource which we will later use to track the status of the network, for instance the IP addresses of its nodes. Here is our CRD.

apiVersion: apiextensions.k8s.io/v1beta1
kind: CustomResourceDefinition
metadata:
    name: bitcoin-networks.bitcoin-controller.christianb93.github.com
spec:
    version: v1
    group: bitcoin-controller.christianb93.github.com
    scope: Namespaced
    subresources:
      status: {}
    names:
      plural: bitcoin-networks
      singular: bitcoin-network
      kind: BitcoinNetwork
    validation:
      openAPIV3Schema:
        properties:
          spec:
            required:
            - nodes
            properties:
              nodes:
                type: int

Step 4: pushing to a public repository and running the controller

Let us now go through the complete deployment cycle once, including the push to a public repository. I assume that you have a user on Docker Hub, (for me, this is christianb93), and have set up a repository called bitcoin-controller in this account. I will also assume that you have done a docker login before running the commands below. Then, building the controller is easy – simply run the following commands, replacing the christianb93 in the last two commands with your username on Docker Hub.

cd $GOPATH/src/github.com/christianb93/bitcoin-controller/cmd/controller
CGO_ENABLED=0 go build
docker build --rm -f ../../build/controller/Dockerfile -t christianb93/bitcoin-controller:latest .
docker push christianb93/bitcoin-controller:latest

Once the push is complete, you can run the controller using a standard manifest file as the one below.

apiVersion: v1
kind: Pod
metadata:
  name: bitcoin-controller
  namespace: default
spec:
  containers:
  - name: bitcoin-controller-ctr
    image: christianb93/bitcoin-controller:latest

Note that this will only pull the image from Docker Hub if we delete the local image using

docker rmi christianb93/bitcoin-controller:latest

from the minikube Docker repository (or did not use that repository at all). You will see that pushing takes some time, this is why I prefer to work with the local registry most of the time and only push to the Docker Hub once in a while.

We now have our build system in place and a working skeleton which we can run in our cluster. This version of the code is available in my GitHub repository under the v0.1 tag. In the next post, we will start to add some meat – we will model our CRD in a Go structure and put our controller in a position to react on newly added bitcoin networks.

Kubernetes storage under the hood part III – storage classes and provisioning

In the last post, we have seen the magic of persistent volume claims in action. In this post, we will look in more details at how Kubernetes actually manages storage.

Storage classes and provisioners

First, we need to understand the concept of a storage class. In a typical environment, there are many different types of storage. There could be some block storage like EBS or a GCE persistent disk, or some local storage like an SSD or a HDD, NFS based storage or some distributed storage like Ceph or StorageOS. So far, we have kept our persistent volume claims platform agnostic, on the other hand, there might be a need to specify in more detail what type of storage we want. This is done using a storage class.

To start, let us use kubectl to list the available storage classes in our standard EKS cluster (you will get different results if you use a different provider).

$ kubectl get storageclass
NAME            PROVISIONER             AGE
gp2 (default)   kubernetes.io/aws-ebs   3h

In this case, there is only one storage class called gp2. This is marked as the default storage class, meaning that in case we define a PVC which does not explicitly refer to a storage class, this class is chosen. Using kubectl with one of the flags --output json or --output yaml, we can get more information on the gp2 storage class. We find that there is an annotation storageclass.kubernetes.io/is-default-class which defines whether this storage class is the default storage class. In addition, there is a field provisioner which in this case is kubernetes.io/aws-ebs.

This looks like a Kubernetes provided component, so let us try to locate its source code in the Kubernetes GitHub repository. A quick search in the source tree will show you that there is a fact a manifest file defining the storage class gp2. In addition, the source tree contains a plugin which will communicate with the AWS cloud provider to manage EBS block storage.

The inner workings of this are nicely explained here. Basically, the PVC controller will use the storage class in the PVC to find the provisioner that is supposed to be used for this storage class. If a provisioner is found, it is asked to create the requested storage dynamically. If no provisioner is found, the controller will just wait until storage becomes available. An external provisioner can periodically scan unmatched volume claims and provision storage for them. It then creates a corresponding persistent storage object using the Kubernetes API so that the PVC controller can detect this storage and bind it to the claim. If you are interested in the details, you might want to take a look at the source code of the external provisioner controller and the example of the Digital Ocean provisioner using it.

So at the end of the day, the workflow is as follows.

  • A user creates a PVC
  • If no storage class is provided in the PVC, the default storage class is merged into the PVC
  • Based on the storage class, the provisioner responsible for creating the storage is identified
  • The provisioner creates the storage and a corresponding Kubernetes PV object
  • The PVC is bound to the PV and available for use in Pods

Let us see how we can create our own storage classes. We have used the AWS EBS provisioner to create GP2 storage, but it does in fact support all storage types (gp2, io1, st1, sc1) offered by Amazon. Let us create a storage class which we can use to dynamically provision HDD storage of type st1.

$ kubectl apply -f - << EOF
apiVersion: storage.k8s.io/v1
kind: StorageClass
metadata:
  name: st1
provisioner: kubernetes.io/aws-ebs
parameters:
  type: st1
EOF
storageclass.storage.k8s.io/st1 created
$ kubectl get storageclass
NAME            PROVISIONER             AGE
gp2 (default)   kubernetes.io/aws-ebs   17m
st1             kubernetes.io/aws-ebs   15s

When you compare this to the default class, you will find that we have dropped the annotation which designates this class as default – there can of course only be one default class per cluster. We have again used the aws-ebs provisioner, but changed the type field to st1. Let us now create a persistent storage claim using this class.

$ kubectl apply -f - << EOF
apiVersion: v1
kind: PersistentVolumeClaim
metadata:
  name: hdd-pvc
  namespace: default
spec:
  accessModes:
    - ReadWriteOnce
  storageClassName: st1
  resources:
    requests:
      storage: 500Gi
EOF

If you submit this, wait until the PV has been created and then use aws ec2 describe-volumes, you will find a new AWS EBS volume of type st1 with a capacity of 500 Gi. As always, make sure to delete the PVC again to avoid unnecessary charges for that volume.

Manually provisioning volumes

So far, we have used a provisioner to automatically provision storage based on storage claims. We can, however, also provision storage manually and bind claims to it. This is done as usual – using a manifest file which describes a resource of kind PersistentVolume. To be able to link this newly created volume to a PVC, we first need to define a new storage class.

$ kubectl apply -f - << EOF
apiVersion: storage.k8s.io/v1
kind: StorageClass
metadata:
  name: cold
provisioner: kubernetes.io/aws-ebs
parameters:
  type: sc1
EOF
storageclass.storage.k8s.io/cold created

Once we have this storage class, we can now manually create a persistent volume with this storage class. The following commands create a new volume with type sc1, retrieve its volume id and create a Kubernetes persistent volume linked to that EBS volume.

$ volumeId=$(aws ec2 create-volume --availability-zone=eu-central-1a --size=1024 --volume-type=sc1  --query 'VolumeId')
$ kubectl apply -f - << EOF
apiVersion: v1
kind: PersistentVolume
metadata:
  name: cold-pv
spec:
  capacity:
    storage: 1024Gi
  accessModes:
    - ReadWriteOnce
  storageClassName: cold
  awsElasticBlockStore:
    volumeID: $volumeId
EOF

Initially, this volume will be available, as there is no matching claim. Let us now create a PVC with a capacity of 512 Gi and a matching storage class.

$ kubectl apply -f - << EOF
apiVersion: v1
kind: PersistentVolumeClaim
metadata:
  name: cold-pvc
  namespace: default
spec:
  accessModes:
    - ReadWriteOnce
  storageClassName: cold
  resources:
    requests:
      storage: 512Gi
EOF

This will create a new PVC and bind it to the existing persistent volume. Note that the PVC will consume the entire 1 Ti volume, even though we have only requested half of that. Thus manually pre-provisioning volumes can be rather inefficient if the administrator and the teams do not agree on standard sizes for persistent volumes.

If we delete the PVC again, we see that persistent volume is not automatically deleted, as it was the case for dynamic provisioning, but survices and can be consumed again by a new matching claim. Similarly, deleting the PV will not automatically delete the underlying EBS volume, and we need to clean up manually.

Using Python to create volume claims

As usual, we close this post with some remarks on how to use Python to create and use persistent volume claims. Again, we omit the typical boilerplate code an refer to the full source code on GitHub for all the details.

First, let us look at how to create and populate a Python object that corresponds to a PVC. We need to instantiate an instance of V1PersistentVolumeClaim. This object again has the typical metadata, contains the access mode and a resource requirement.

pvc=client.V1PersistentVolumeClaim()
pvc.api_version="v1"
pvc.metadata=client.V1ObjectMeta(
                  name="my-pvc")
spec=client.V1PersistentVolumeClaimSpec()
spec.access_modes=["ReadWriteOnce"]
spec.resources=client.V1ResourceRequirements(
                  requests={"storage" : "32Gi"})
pvc.spec=spec

Once we have this, we can submit an API request to Kubernetes to actually create the PVC. This is done using the method create_namespaced_persistent_volume_claim of the API object. We can then create a pod specification that uses this PVC, for instance as part of a deployment. In this template, we first need a container specification that contains the mount point.

container = client.V1Container(
                name="alpine-ctr",
                image="httpd:alpine",
                volume_mounts=[client.V1VolumeMount(
                    mount_path="/test",
                    name="my-volume")])

In the actual Pod specification, we also need to populate the field volumes. This field contains a list of volumes, which again refer to a volume source. So we end up with the following code.

pvcSource=client.V1PersistentVolumeClaimVolumeSource(
              claim_name="my-pvc")
podVolume=client.V1Volume(
              name="my-volume",
              persistent_volume_claim=pvcSource)
podSpec=client.V1PodSpec(containers=[container], 
                         volumes=[podVolume])

Here the claim name links the volume to our previously defined PVC, and the volume name links the volume to the mount point within the container. Starting from here, the creation of a Pod using this specification is then straightforward.

This completes our short series on storage in Kubernetes. In the next post on Kubernetes, we will look at a typical application of persistent storage – stateful applications.

Kubernetes storage under the hood part II – persistent storage

The storage types that we have discussed so far realize ephemeral storage, i.e. storage tied to the lifecycle of the Pod on a specific node. Of course, there are many use cases like databases or other stateful applications that require storage that is persistent and has a lifecycle independent of the Pod. In this post, we look at different ways to realize this in Kubernetes.

Using cloud provider specific storage directly

The easiest – and historically first – way to do this is to directly refer to an existing piece of persistent storage provided by the underlying cloud platform. Recall that when you define and use volumes, you define the volume as part of Pod specification, assign a name and tell Kubernetes which type of volume it should allocate – like emptyDir or hostPath. If you check the list of supported volumes, you will find some volumes that are specific to a cloud provider, for instance awsElasticBlockStore. This allows you to mount a pre-existing AWS Elastic Block Store volume into your Pod. As EBS volumes can only be attached to one instance at a time, you can only connect to this volume from one Pod.

To try this out, we of course have to generate an EBS volume first (as always, be aware of the charges and make sure to delete the volume if it is no longer needed). EBS volumes need to be created within an availability zone (which you can figure out using aws ec2 describe-availability-zones). In my example, I will use the availability zone eu-central-1a. The following command creates a 16 GiB GP2 (SSD) drive in this availability zone.

$ aws ec2 create-volume --availability-zone=eu-central-1a\
           --size=16 --volume-type=gp2

If you now run aws ec2 describe-volumes --output json to list all volumes, you will see several volumes that have the status “in-use” (these are the root volumes of your nodes) and one new volume that has the status “available”. We will need the volume ID of this volume, in my case this is vol-0eb2505d4b7d035cb. Let us try to attach this to a Pod using the following manifest file.

apiVersion: v1
kind: Pod
metadata:
  name: ebs-demo
  namespace: default
spec:
  containers:
  - name: ebs-demo-ctr
    image: httpd:alpine
    volumeMounts:
      - mountPath: /test
        name: test-volume
  volumes:
  - name: test-volume
    awsElasticBlockStore: 
      volumeID: vol-0eb2505d4b7d035cb

Sometimes you learn most from your mistakes. If you apply this manifest file chances are that your Pod will never be fully established, but will remain in the state “ContainerCreating” forever. What is going wrong?

To find the answer, use the AWS CLI or the AWS Web console to look at the availability zones of the instance on which the Pod is scheduled and the volume. In my example, Kubernetes did schedule the Pod on a node running in eu-central-1c, whereas the volume was created in eu-central-1a. Unfortunately, EBS volumes cannot be attached across availability zones, and the creation of the Pod fails.

Fortunately, there is a way out. Note that EKS will attach a label to the nodes which capture there availability zone. This label is called failure-domain.beta.kubernetes.io/zone. Now, Kubernetes has a general mechanism called node selector. This allows you to instruct the Kubernetes scheduler to move Pods only on specific nodes, matching certain selection criteria. These criteria are provided in the section nodeSelector of the Pod specification. So the following updated manifest file makes sure that the node will be scheduled in the availability zone in which we did create the volume.

apiVersion: v1
kind: Pod
metadata:
  name: ebs-demo
  namespace: default
spec:
  containers:
  - name: ebs-demo-ctr
    image: httpd:alpine
    volumeMounts:
      - mountPath: /test
        name: test-volume
  volumes:
  - name: test-volume
    awsElasticBlockStore: 
      volumeID: vol-0eb2505d4b7d035cb
  nodeSelector:
    failure-domain.beta.kubernetes.io/zone: eu-central-1a

If you apply this manifest file and wait for some time, you will see that the Pod comes up. If you again run aws ec2 describe-volumes, you will find that the volumes status has changed to “in-use” and that EKS has automatically attached it to the node on which the Pod is scheduled (provided, of course, that you have a node running in eu-central-1a, which is not a given if you only use two nodes as we do it – in this case you will have to create the volume in one of the availability zones in which you have a node). You can also attach to the Pod and run mount to verify that a device has been mounted on /test. Combining the output of docker inspect and mount on the node will tell you that the following has happened.

  • Kubernetes has asked AWS to attach our volume as /dev/xvdba to the node
  • Then Kubernetes did create a directory specific to the Pod
  • The volume was mounted into this directory
  • Finally, Kubernetes did create a Docker bind mount to hook up this directory on the node with the directory /test in the container file system

This example nicely demonstrates that using existing persistent storage in the underlying cloud platform is possible, but comes with some drawbacks. An administrator will have to manage these volumes manually, using whatever tools your cloud provider makes available. There are limitations if your cluster is spanning multiple availability zones, and of course you tie all your manifest files directly to a specific cloud provider. In addition, Kubernetes tries to follow the idea of “run everywhere”, which does not combine well with an approach where each individual cloud provider needs to be hardcoded into the core Kubernetes code base. As so often in computer science, this situation almost cries for an additional abstraction layer between Pod volumes and the underlying storage. This abstraction layer exists and is the topic of the next section.

Persistent volume claims

In the previous section, we have defined volumes as part of a Pod specification. These volumes – which we should actually call Pod volumes – are linked to the lifecycle of an individual Pod. We have seen that these volumes can refer to existing storage within your cloud layer, but that this comes with some drawbacks and requires manual provisioning outside of the Kubernetes world.

To change this, Kubernetes defines an additional abstraction layer between the storage as provided by the cloud platform and the Pod volumes. The most important objects we need to discuss in order to understand this are persistent volumes (PV) and persistent volume claims (PVC).

Let us start with persistent volumes. Essentially, a persistent volume is a Kubernetes object that represents a piece of storage in the underlying cloud platform. Typically, volumes are created dynamically, but we will see in the next post in this series that they can also be managed manually. The important thing is that volumes are first-class Kubernetes citizens and have a lifecycle independent of that of Pods.

Volumes represent the supply side of storage on your cluster. The demand side is represented by volume claims. A persistent volume claim is an object that a user creates to let Kubernetes know that a certain amount of storage is required. If the cluster is set up for it, Kubernetes will then automatically try to fulfill the claim, i.e. to either find an existing, unused volume that matches the claim or to provision a volume dynamically, using a so-called provisioner. A persistent volume claim can then be referenced in a Pod volume which in turn can be mounted into a container.

KubernetesVolumesIII

To get an idea what this means, let us again consider an example. The following manifest file describes a persistent volume claim.

apiVersion: v1
kind: PersistentVolumeClaim
metadata:
  name: ebs-pvc
  namespace: default
spec:
  accessModes:
    - ReadWriteOnce
  resources:
    requests:
      storage: 4Gi

In addition to the standard fields, we have a specification that consists of two sections. The first section specifies the access mode. Here we use ReadWriteOnce, which states that we want a volume which can be accessed by one Pod at a time, reading and writing. In the second section, we specify the resources, i.e. the amount of storage that we need, in our case 4 Gigabytes of storage. This example already demonstrates one nice feature of a PVC – it does not refer at all to a specific type of volume or a specific cloud platform (it does so indirectly, via the mechanism of storage classes, which we will investigate in the next post).

When we apply this manifest file and wait for a few seconds, we can look at the objects that have been created. First, run kubectl get pvc to get a list of all persistent volume claims.

$ kubectl get pvc
NAME      STATUS   VOLUME                                     CAPACITY   ACCESS MODES   STORAGECLASS   AGE
ebs-pvc   Bound    pvc-63521bd7-4e51-11e9-8e51-0af6f9d0ca50   4Gi        RWO            gp2            7m

So as expected, we have a new persistent volume claim that has been generated. The status of this PVC is “bound”, telling us that the provisioner working behind the scenes was able to find a matching volume. We also find a reference to the volume in the output. So let us list this volume.

$ kubectl get pv
NAME                                       CAPACITY   ACCESS MODES   RECLAIM POLICY   STATUS   CLAIM             STORAGECLASS   REASON   AGE
pvc-63521bd7-4e51-11e9-8e51-0af6f9d0ca50   4Gi        RWO            Delete           Bound    default/ebs-pvc   gp2   

As stated above, this volume exists as an independent entity that we can refer to by its name and that has some properties. When we append --output json to get all the details, we see a few interesting things.

First, the volume has a field claimRef which tells us to which claim this volume is bound. This is only one field, not an array. Similarly, the PVC has a field volumeName referring to the underlying volume, which is again not an array. So the relation between a PV and a PVC is one-to-one. As mentioned in the documentation, this can lead to overprovisioning. If, for instance, you request 4 Gi, and there is a free volume with 8 Gi, the provisioner might decide to bind the PVC to this volume, even though only 4 Gi were requested.

Another interesting information that we get from the JSON output is that a volume has a label that tells us in which availability zone the volume (or, more precisely, the underlying EBS volume) is located. And, finally, the spec section contains a field that lets us locate the underlying EBS storage. You can use the following statements to extract this information and use the AWS CLI to print out some details of this volume.

$ fullVolumeID=$(kubectl get pv\
            --output=jsonpath='{.items[0].spec.awsElasticBlockStore.volumeID}')
$ volumeID=$(echo $fullVolumeID | sed 's/aws:\/\/.*\///')
$ aws ec2 describe-volumes --volume-id=$volumeID --output json

Let us now actually use this volume, i.e. attach it to a Pod. Here is a manifest file which will bring up a Pod mounting this volume.

apiVersion: v1
kind: Pod
metadata:
  name: pv-demo
  namespace: default
spec:
  containers:
  - name: pv-demo-ctr
    image: httpd:alpine
    volumeMounts:
      - mountPath: /test
        name: test-volume
  volumes:
  - name: test-volume
    persistentVolumeClaim:
      claimName: ebs-pvc

We see that at the point in the file were we did previously refer directly to an EBS volume, we now refer to the PVC. So again, there is no EBS or EKS specific data in this manifest file, and we can theoretically use the same manifest file on any cloud platform.

When you apply this manifest file, you will notice that it takes significantly longer for the containers to come up, this is because behind the scenes, Kubernetes needs to attach the EBS volume to the node on which the Pod is scheduled, which takes some time.

We can now again analyze the structure of the file systems in the container and on the node. If we do this, we will find a very similar picture as above. The container has a bind mount into a directory managed by Kubernetes. This directory in turn is a mount point for the device /dev/xvdbu. If we look at the output of aws ec2 describe-volumes, we find that this is the device to which AWS has attached the EBS volume behind the PVC. So the outcome of the entire exercise is the same as before, with the difference that no manual provisioning of the volume as necessary.

In addition, Kubernetes is smart enough to place our Pod in a the same availability zone in which the volume is located. In fact, as explained in the documentation on multi-zone capabilities, the Kubernetes scheduler will make sure that a Pod that requires a PV located in a given availability zone will only be placed on a node running in that zone. It can, however, happen that a volume is created in an availability zone where there is no node at all, rendering it unusable (see this GitHub issue for a discussion).

Let us now investigat the lifecycle of this storage. To do this, let us create a file in our newly mounted directory, kill the pod, bring it up again and list the contents of the volume (this assumes that you have saved the manifest file for the Pod in a file called pvUsage.yaml).

$ kubectl exec -it pv-demo touch /test/hello
$ kubectl delete pod pv-demo
pod "pv-demo" deleted
$ kubectl apply -f pvUsage.yaml
pod/pv-demo created
$ # Wait for container to be ready
$ kubectl exec -it pv-demo ls /test
hello       lost+found

So, as expected, the volume and its content have survived the restart of the Pod. If a persistent volume claim is deleted, however, Kubernetes will automatically delete the underlying volume and delete the corresponding storage in the cloud platform layer. When you shutdown a cluster, make sure to delete all PVCs first, otherwise orphaned block storage volumes not controlled by Kubernetes any more could result.

We have now covered the basics of persistent storage in Kubernetes – but of course there is much more that we have still left open. How is storage actually provisioned? How does the platform know which type of storage we need when we issue a PVC? And how can we manually create storage? These are the topics that we will discuss in the next post in this series.

Kubernetes storage under the hood part I – ephemeral storage

So far, we have mainly discussed how compute and network resources are used and managed with Kubernetes. We will now turn to the third fundamental element of a container platform – storage.

Docker storage concepts

Before we talk about Kubernetes storage concepts, let us first recall how storage is managed in Docker. The following tests assume that you have a local installation of Docker on a Linux workstation (or virtual machine, of course). As a refresher, you might want to take a look at my introduction into Docker internals before reading on.

First, let us start a Docker container and spawn a shell. The easiest way to do this is the busybox image. So let us spin up a busybox container, attached to the terminal, and run mount to inspect its file system.

$ docker run -it busybox
/ # mount
overlay on / type overlay (rw,relatime,lowerdir=/var/lib/docker/overlay2/l/BNUAN2FS4K75ZLQFSZVQWXRLUU:/var/lib/docker/overlay2/l/UKEGOK4TLTD2T4XN5KIEPN7JXF,upperdir=/var/lib/docker/overlay2/e8f16f0d705fb8e4677b605796b7319ef3f0226e2ad173b506e13b479afa515f/diff,workdir=/var/lib/docker/overlay2/e8f16f0d705fb8e4677b605796b7319ef3f0226e2ad173b506e13b479afa515f/work)
proc on /proc type proc (rw,nosuid,nodev,noexec,relatime)
tmpfs on /dev type tmpfs (rw,nosuid,size=65536k,mode=755)
[REDACTED - SOME LINES REMOVED]

Your output will most likely look differently, but the general pattern will be the same. The first mount point that we see is the mount for the root directory. On newer Docker versions, this will be an overlay2 file system, on older Docker versions, it will be of type aufs. This entry points to one or more actual files on the host system that are located in the directory /var/lib/docker/ which is managed by Docker. These are the files in which the actual content of the root filesystem is stored.

The data on that file system is volatile and linked to the lifecycle of the container. To see this, let us create a file in the containers root file system and exit the container.

/ # echo "dancing in the rain" > /franky
/ # exit

This will stop the container, but not remove it – it will still exist and be visible in the output of docker ps -a. If you restart the container and attach to the running container, you will find that the file is still there and its content has been preserved. If, however, you remove the container using docker rm, the corresponding files on the host file system will be removed and the content of the file system of our container is lost. In that sense, these volumes are ephemeral – they survive across restarts, but die if the container is removed.

But Docker can do more – we can also use persistent storage. One option to do this are bind mounts. A bind mount maps a directory or a file from the host file system into the namespace of the container and attaches it to a mount point. To see an example, create a temporary directory on your host system and put some data into it. We can then mount this directory into a new Docker container using the -v option.

$ mkdir /tmp/ctr-test/
$ echo "Hello World" > /tmp/ctr-test/hello
$ docker run -v /tmp/ctr-test:/ctr-test/ -it busybox 
/ # cat /ctr-test/hello
Hello World
/# exit

So the content of the directory /tmp/ctr-test on the host becomes accessible within the container as /ctr-test (of course I could have chosen any other name as well). We can also see this mount point in the output of docker inspect. Use docker ps -a to find out the ID of the busybox container, in my case fd8ef21ba685, and then run

$ docker inspect fd8ef21ba685 --format="{{json .Mounts}}"
[{"Type":"bind","Source":"/tmp/ctr-test","Destination":"/ctr-test","Mode":"","RW":true,"Propagation":"rprivate"}]

So the mount point shows up as a mount point of type bind in the list of mounts of our container.

We remark that Docker also has a more advanced way to mount storage referred to as volumes. In contrast to a bind mount, a volume is an object managed by Docker, backed by files in the Docker controlled directories. Volumes can be created manually or dynamically, can be given a name and can be mounted into a container. As they are objects with an independent lifecycle, they survive container eviction and can be mounted to more than one container. However, we will not look deeper into this as (at least to my knowledge) this feature is not used by Kubernetes.

Ephemeral storage in Kubernetes

Now let us try out how things change if we use Kubernetes to spin up our containers.

$ kubectl run -i --tty busybox --image=busybox --restart=Never
/ # / # mount
overlay on / type overlay (rw,relatime,lowerdir=/var/lib/docker/overlay2/l/57X3FQLOLATAMPLAASUMBKHD5W:/var/lib/docker/overlay2/l/Q6HSQOG4NX7UHGVZEPQIZI43KQ,upperdir=/var/lib/docker/overlay2/f183dfd193c86bf43ebca4ae7d08cbfd6e268229f3bd59c70be2f48d9dc0937f/diff,workdir=/var/lib/docker/overlay2/f183dfd193c86bf43ebca4ae7d08cbfd6e268229f3bd59c70be2f48d9dc0937f/work)
[REDACTED]

So we see pretty much the same picture. The root volume of the container is again an overlay file system that is backed by directories managed by Docker on the host on which the pod is running.

If, however, you ssh into the node on which the container is running and do a docker inspect as before, you will find that there are actually a couple of bind mounts that we have not explicitly specified. These bind mounts are added by Kubernetes to give the container access to some configuration data like the token that can be used to connect to a Kubernetes service account, or host name resolutions (the own IP address of the container, for instance). Up to this point, our picture is actually quite simple.

KubernetesVolumesI

Now things get a bit more complicated if you want to mount additional volumes. Kubernetes does in fact offer a large number of different volume types. Some of these volume types are ephemeral, i.e. the data is potentially lost if the pod dies or is rescheduled to a different node, other types of volumes are persistent. In this post, we focus on ephemeral storage and discuss different strategies to attach persistent storage in a later post.

Mount ephemeral storage of type emptyDir

In Kubernetes, we can define volumes on the level of an individual pod and attach these volumes to one or more containers that are running in this pod. Kubernetes offers several types of volumes. The type we are going to look at first is called an emptyDir because, from the point of view of a container, it is exactly that – a directory which is initially empty.

To see this in action, let us look at the following manifest file.

apiVersion: v1
kind: Pod
metadata:
  name: empty-dir-demo
  namespace: default
spec:
  containers:
  - name: empty-dir-demo-ctr
    image: httpd:alpine
    volumeMounts:
      - mountPath: /test
        name: test-volume
  volumes:
  - name: test-volume
    emptyDir: {}

This manifest file defines an individual Pod, as we have seen it before. However, there are a few new elements which are populated in this manifest. The Pod specification contains a new field volumes, which is an array of volume objects. This volume has a name and an additional field which indicates the type of the volume. The documentation lists many of them, here we are working with a volume of type emptyDir.

In the container specification, we now refer to this volume. This instructs Kubernetes to create the volume and to mount it into this container at the defined mount point. To see this in action, let us apply this manifest file, spawn a shell in the pod that is created and inspect its file system.

$ kubectl apply -f https://raw.githubusercontent.com/christianb93/Kubernetes/master/emptyDir.yaml 
pod/empty-dir-demo created
$ kubectl exec -it empty-dir-demo "/bin/bash"
bash-4.4# mount | grep "test"
/dev/xvda1 on /test type xfs (rw,noatime,attr2,inode64,noquota)

So we see that Kubernetes has actually mounted a new file system onto the mount point /test. To figure out how this is realized, let us take a closer look at the Docker container that has been created. So ssh into the node on which the Pod is running and run the following commands (this assumes that jq is installed on the node, which is the default when using the standard AWS AMI).

$ containerId=$(docker ps | grep "httpd" | awk '{print $1}')
$ docker inspect $containerId | jq -r '.[0].Mounts[]'
{
  "Type": "bind",
  "Source": "/var/lib/kubelet/pods/0914a859-4da2-11e9-931c-06a2d10ef1fe/volumes/kubernetes.io~empty-dir/test-volume",
  "Destination": "/test",
  "Mode": "",
  "RW": true,
  "Propagation": "rprivate"
}
[ ... more output ... ]

So we find that Kubernetes realizes an emptyDir volume as a bind mount, i.e. Kubernetes will create a directory on the nodes local file system and use a Docker bind mount to mount this into the container. Of course, this directory will initially be empty (as the name strongly suggests). Let us see what happens if we actually write something onto this file system. The following commands (to be run again on the node on which the Pod is running) extract the directory which is used for the bind mount from the output of docker inspect and list the contents of this directory.

$ dir=$(docker inspect $containerId | jq -r '.[0].Mounts[] | select(.Destination=="/test") | .Source')
$ sudo ls $dir

If you run this now, you will find that the directory is empty. Now switch back to the terminal attached to the Pod and create a file in the /test directory.

bash-4.4# echo "hello" > /test/hello

If you now list the directories content again, you will find that a file hello has been created.

Knowing how an emptyDir is implemented now makes it easy to understand the statements on the lifecycle in the Kubernetes documentation. It is stored in a directory specific for the Pod, i.e. it is initially created when the Pod is created and removed when the Pod is removed. It survices container restarts, but when the Pod is migrated to a different node, the content will be lost. In that sense, it is ephemeral storage.

KubernetesVolumesII

Accessing host-local file systems

We have found that a volume of type emptyDir is nothing but a Docker bind mount to a Pod specific directory managed by Kubernetes. Of course, Kubernetes also offers a way to set up bind mounts to existing directories in the host file system (needless to say that this might be a security risk). This done using a volume of type hostPath as in the example below.

apiVersion: v1
kind: Pod
metadata:
  name: host-path-demo
  namespace: default
spec:
  containers:
  - name: host-path-demo-ctr
    image: httpd:alpine
    volumeMounts:
      - mountPath: /test
        name: test-volume
  volumes:
  - name: test-volume
    hostPath: 
      path: /etc

When you run this and attach to the resulting Pod, you will find that the content of the directory /test now match the content of the directory /etc on the host. Using again docker inspect on the node on which the Pod is running, you will find that Kubernetes has created an additional bind mount for the container which links the containers /test directory to the directory /etc on the host. Consequently, the contents of a hostPath volume will survive container restarts but will not be accessible anymore once the Pod is migrated to a different host.

Watching Kubernetes networking in action

In this post, we will look in some more detail into networking in a Kubernetes cluster. Even though the Kubernetes networking model is independent of the underlying cloud provider, the actual implementation does of course depend on the cloud provider which communicates with Kubernetes through a CNI plugin.

I will continue to use EKS, so some of this will be EKS specific. To work with me through the example, you will first have to bring up your cluster, start two nodes and deploy a pod running a httpd on one of the nodes. I have written a script up.sh and a manifest file that automates all this. To download and apply all this, enter

$ git clone https://github.com/christianb93/Kubernetes.git
$ cd Kubernetes/cluster
$ chmod 700 up.sh
$ ./up.sh
$ kubectl apply -f ../pods/alpine.yaml

Node-to-Pod networking

Now let us log into the node on which the container is running and collect some information on the local network interface attached to the VM.

$ ifconfig eth0
eth0: flags=4163  mtu 9001
        inet 192.168.118.64  netmask 255.255.192.0  broadcast 192.168.127.255
        inet6 fe80::2b:dcff:fee7:448c  prefixlen 64  scopeid 0x20
        ether 02:2b:dc:e7:44:8c  txqueuelen 1000  (Ethernet)
        RX packets 197837  bytes 274587781 (261.8 MiB)
        RX errors 0  dropped 0  overruns 0  frame 0
        TX packets 25656  bytes 2389608 (2.2 MiB)
        TX errors 0  dropped 0 overruns 0  carrier 0  collisions 0

So the local IP address of the node is 192.168.118.64. If we do a kubectl get pods -o wide, we get a different IP address – 192.168.99.199 – for the pod. Let us curl this from the node.

$ curl 192.168.99.199
<h1>It works!</h1>

So apparently we have reached our httpd. To understand why this works, let us investigate the network configuration in more detail. First, on the node on which the container is running, let us take a look at the network configuration inside the container.

$ ID=$(docker ps --filter name=alpine-ctr --format "{{.ID}}")
$ docker exec -it $ID "/bin/bash"
bash-4.4# ip link
1: lo:  mtu 65536 qdisc noqueue state UNKNOWN qlen 1000
    link/loopback 00:00:00:00:00:00 brd 00:00:00:00:00:00
3: eth0@if6:  mtu 9001 qdisc noqueue state UP 
    link/ether 4a:8b:c9:bb:8c:8e brd ff:ff:ff:ff:ff:ff
bash-4.4# ifconfig eth0
eth0      Link encap:Ethernet  HWaddr 4A:8B:C9:BB:8C:8E  
          inet addr:192.168.99.199  Bcast:192.168.99.199  Mask:255.255.255.255
          UP BROADCAST RUNNING MULTICAST  MTU:9001  Metric:1
          RX packets:12 errors:0 dropped:0 overruns:0 frame:0
          TX packets:0 errors:0 dropped:0 overruns:0 carrier:0
          collisions:0 txqueuelen:0 
          RX bytes:936 (936.0 B)  TX bytes:0 (0.0 B)
bash-4.4# ip route
default via 169.254.1.1 dev eth0 
169.254.1.1 dev eth0 scope link

What do we learn from this? First, we see that inside the container namespace, there is a virtual ethernet device eth0, with IP address 192.168.99.199. If you run kubectl get pods -o wide on your local workstation, you will find that this is the IP address of the Pod. We also see that there is a route in the container namespace that direct all traffic to this interface. The output of the ip link command also shows that this device is a virtual ethernet device that has a paired device (with index if6) in a different namespace. So let us exit the container, go back to the node and try to figure out what the network configuration on the node is.

$ ip link
1: lo:  mtu 65536 qdisc noqueue state UNKNOWN mode DEFAULT group default qlen 1000
    link/loopback 00:00:00:00:00:00 brd 00:00:00:00:00:00
2: eth0:  mtu 9001 qdisc pfifo_fast state UP mode DEFAULT group default qlen 1000
    link/ether 02:2b:dc:e7:44:8c brd ff:ff:ff:ff:ff:ff
3: eni3f5399ec799:  mtu 9001 qdisc noqueue state UP mode DEFAULT group default 
    link/ether 66:37:e5:82:b1:f6 brd ff:ff:ff:ff:ff:ff link-netnsid 0
4: enie68014839ee@if3:  mtu 9001 qdisc noqueue state UP mode DEFAULT group default 
    link/ether f6:4f:62:dc:38:18 brd ff:ff:ff:ff:ff:ff link-netnsid 1
5: eth1:  mtu 9001 qdisc pfifo_fast state UP mode DEFAULT group default qlen 1000
    link/ether 02:e8:f0:26:a7:3e brd ff:ff:ff:ff:ff:ff
6: eni97d5e6c4397@if3:  mtu 9001 qdisc noqueue state UP mode DEFAULT group default 
    link/ether b2:c9:58:c0:20:25 brd ff:ff:ff:ff:ff:ff link-netnsid 2
$ ifconfig eth0
eth0: flags=4163  mtu 9001
        inet 192.168.118.64  netmask 255.255.192.0  broadcast 192.168.127.255
        inet6 fe80::2b:dcff:fee7:448c  prefixlen 64  scopeid 0x20
        ether 02:2b:dc:e7:44:8c  txqueuelen 1000  (Ethernet)
        RX packets 197837  bytes 274587781 (261.8 MiB)
        RX errors 0  dropped 0  overruns 0  frame 0
        TX packets 25656  bytes 2389608 (2.2 MiB)
        TX errors 0  dropped 0 overruns 0  carrier 0  collisions 0
$ ip route
default via 192.168.64.1 dev eth0 
169.254.169.254 dev eth0 
192.168.64.0/18 dev eth0 proto kernel scope link src 192.168.118.64 
192.168.89.17 dev eni3f5399ec799 scope link 
192.168.99.199 dev eni97d5e6c4397 scope link 
192.168.109.216 dev enie68014839ee scope link

Here we see that – in addition to a few other interfaces – there is a device eth0 to which all traffic is sent by default. However, there is also a device eni97d5e6c4397 which is the other end of the interface visible in the container. And there is a route that sends all traffic that is directed to the IP address of the pod to this interface. Overall, this gives a picture which seems familiar from our earlier analysis of docker networking

KubernetesNetworkingOne

If we try to establish a connection to the httpd running in the pod, the routing table entry on the node will send the traffic to the interface eni97d5e6c4397. This is one end of a veth-pair, the other end appears inside the container as eth0. So from the containers point of view, this is incoming traffic received via eth0, which is happily accepted and processed by the httpd. The reply goes the other way – it is directed to eth0 inside the container, travels via the veth pair and ends up inside the host namespace, coming from eni97d5e6c4397.

Pod-to-Pod networking across nodes

Now let us try something else. Log into the second node – on which the container is not running – and try the curl from there. Surprisingly, this works as well! What we have seen so far does not explain this, so there is probably a piece of magic that we are still missing. To find this, let us use the aws cli to print out the network interfaces attached to the node on which the container is running (the following snippet assumes that you have the extremely helpful tool jq installed on your PC).

$ nodeName=$(kubectl get pods --output json | jq -r ".items[0].spec.nodeName")
$ aws ec2 describe-instances --output json --filters Name=private-dns-name,Values=$nodeName --query "Reservations[0].Instances[0].NetworkInterfaces"
---- SNIP -----
{
        "MacAddress": "02:e8:f0:26:a7:3e",
        "SubnetId": "subnet-06088e09ce07546b9",
        "PrivateDnsName": "ip-192-168-84-108.eu-central-1.compute.internal",
        "VpcId": "vpc-060469b2a294de8bd",
        "Status": "in-use",
        "Ipv6Addresses": [],
        "PrivateIpAddress": "192.168.84.108",
        "Groups": [
            {
                "GroupName": "eks-auto-scaling-group-myCluster-NodeSecurityGroup-1JMH4SX5VRWYS",
                "GroupId": "sg-08163e3b40afba712"
            }
        ],
        "NetworkInterfaceId": "eni-0ed2f1cf4b09cb8be",
        "OwnerId": "979256113747",
        "PrivateIpAddresses": [
            {
                "Primary": true,
                "PrivateDnsName": "ip-192-168-84-108.eu-central-1.compute.internal",
                "PrivateIpAddress": "192.168.84.108"
            },
            {
                "Primary": false,
                "PrivateDnsName": "ip-192-168-72-200.eu-central-1.compute.internal",
                "PrivateIpAddress": "192.168.72.200"
            },
            {
                "Primary": false,
                "PrivateDnsName": "ip-192-168-96-163.eu-central-1.compute.internal",
                "PrivateIpAddress": "192.168.96.163"
            },
            {
                "Primary": false,
                "PrivateDnsName": "ip-192-168-99-199.eu-central-1.compute.internal",
                "PrivateIpAddress": "192.168.99.199"
            }
        ],
---- SNIP ----

I have removed some of the output to keep it readable. We see that AWS has attached several elastic network interfaces (ENI) to our node. An ENI is a virtual network interface that AWS creates and manages for you. Each node can have more than one ENI attached, and each ENI can have a primary and multiple secondary IP addresses.

If you look at the last line of the output, you see that there is a network interface eni-0ed2f1cf4b09cb8be that has, as one of the secondary IP addresses, the IP address 192.168.99.199. This is the IP address of our Pod! Let us now go back to the node and inspect its network configuration once more. You will not find a network interface with this exact name, but you will find a network interface on the node on which the pod is running which has the same MAC address, namely eth1.

$ ifconfig eth1
eth1: flags=4163  mtu 9001
        inet6 fe80::e8:f0ff:fe26:a73e  prefixlen 64  scopeid 0x20
        ether 02:e8:f0:26:a7:3e  txqueuelen 1000  (Ethernet)
        RX packets 224  bytes 6970 (6.8 KiB)
        RX errors 0  dropped 0  overruns 0  frame 0
        TX packets 20  bytes 1730 (1.6 KiB)
        TX errors 0  dropped 0 overruns 0  carrier 0  collisions 0

This is an ordinary VPC interface and visible in the entire VPC under all of its IP addresses. So if we curl our httpd from the second node, the traffic will leave that node via the default interface, be picked up by the VPC, routed to the node on which the pod is running and enter via eth1. As IP forwarding is enabled on this node, the traffic will be routed to the Pod and arrive at the httpd.

This is the missing piece of magic we have been looking for. In fact, for every pod running on a node, EKS will add an additional secondary IP address to an ENI attached to the node (and attach additional ENIs if needed) which will make the Pod IP addressses visible in the entire VPC. This mechanism is nicely described in the documentation of the CNI plugin which EKS uses. So we now have the following picture.

KubernetesNetworkingTwo

So this allows us to run our httpd in such a way that it can be reached from the entire Pod network (and the entire VPC). Note, however, that it can of course not be reached from the outside world. It is interesting to repeat this experiment with a slighly adapted YAML file that uses the containerPort field:

apiVersion: v1
kind: Pod
metadata:
  name: alpine
  namespace: default
spec:
  containers:
  - name: alpine-ctr
    image: httpd:alpine
    ports: 
      - containerPort: 80

If we remove the old Pod and use this YAML file to create a new pod, we will find that the configuration does not change at all. In particular, running docker ps on the node on which the Pod is scheduled will teach you that this port specification is not the equivalent of the port specification of the docker run port mapping feature – as the Kubernetes API specification states, this field is informational.

Implementation of services

Let us now see how this picture changes if we add a service. First, we will use a service of type ClusterIP, i.e. a service that will make our httpd reachable from within the entire cluster under a common IP address. For that purpose – after deleting our existing pods – let us create a deployment that brings up two instances of the httpd.

$ kubectl apply -f https://raw.githubusercontent.com/christianb93/Kubernetes/master/pods/deployment.yaml

Once the pods are up, you can again use curl to verify that you can talk to every pod from every node and every pod. Now let us create a service.

$ kubectl apply -f https://raw.githubusercontent.com/christianb93/Kubernetes/master/network/service.yaml

Once that has been done, enter kubectl get svc to get a list all services. You should see a newly created service alpine-service. Note down its cluster IP address – in my case this was 10.100.11.202.

Now log into one of the nodes again, attach to the container, install curl there and try to connect to port 10.100.11.202:8080

$ ID=$(docker ps --filter name=alpine-ctr --format "{{.ID}}")
$ docker exec -it $ID "/bin/bash"
bash-4.4# apk add curl
OK: 124 MiB in 67 packages
bash-4.4# curl 10.100.11.202:8080
<h1>It works!</h1>

So, as promised by the definition of s service, the httpd is visible within the cluster under the cluster IP address of the service. The same works if we are on a node and not attached to a container.

To see how this works, let us log out of the container again and search the NAT tables for the cluster IP address of the service.

$ sudo iptables -S -t nat | grep 10.100.11.202
-A KUBE-SERVICES -d 10.100.11.202/32 -p tcp -m comment --comment "default/alpine-service: cluster IP" -m tcp --dport 8080 -j KUBE-SVC-SXWLG3AINIW24QJC

So we see that Kubernetes (more precisely the kube-proxy running on each node) has added a NAT rule that captures traffic directed towards the service IP address to a special chain. Let us dump this chain.

$ sudo iptables -S -t nat | grep KUBE-SVC-SXWLG3AINIW24QJC
-N KUBE-SVC-SXWLG3AINIW24QJC
-A KUBE-SERVICES -d 10.100.11.202/32 -p tcp -m comment --comment "default/alpine-service: cluster IP" -m tcp --dport 8080 -j KUBE-SVC-SXWLG3AINIW24QJC
-A KUBE-SVC-SXWLG3AINIW24QJC -m comment --comment "default/alpine-service:" -m statistic --mode random --probability 0.50000000000 -j KUBE-SEP-YRELRNVKKL7AIZL7
-A KUBE-SVC-SXWLG3AINIW24QJC -m comment --comment "default/alpine-service:" -j KUBE-SEP-BSEIKPIPEEZDAU6E

Now this is actually pretty interesting. The first line is simply the creation of the chain. The second line is the line that we already looked at above. The next two lines are the lines we are looking for. We see that, with a probability of 50%, we either jump to the chain KUBE-SEP-YRELRNVKKL7AIZL7 or to the chain KUBE-SEP-BSEIKPIPEEZDAU6E. Let us display one of them.

$ sudo iptables -S KUBE-SEP-BSEIKPIPEEZDAU6E -t nat 
-N KUBE-SEP-BSEIKPIPEEZDAU6E
-A KUBE-SEP-BSEIKPIPEEZDAU6E -s 192.168.191.152/32 -m comment --comment "default/alpine-service:" -j KUBE-MARK-MASQ
-A KUBE-SEP-BSEIKPIPEEZDAU6E -p tcp -m comment --comment "default/alpine-service:" -m tcp -j DNAT --to-destination 192.168.191.152:80

So we see the that this chain has two rules. The first rule marks all packages that are originating from the pod running on this node, this mark is later evaluated in the forwarding rules to make sure that the packet is accepted for forwarding. The second rule is where the magic happens – it performs a DNAT, i.e. a destination NAT, and sends our packets to one of the pods. The rule KUBE-SEP-YRELRNVKKL7AIZL7 is similar, with the only difference that it sends the packets to the other pod. So we see that two things are happening

  • Traffic directed towards port 8080 of the cluster IP address is diverted to one of the pods
  • Which one of the pods is selected is determined randomly, with a probability of 50% for both pods. Thus these rules implement a simple load balancer.

Let us now see how things change when we use a service of type NodePort. So let us use a slightly different YAML file.

$ kubectl delete -f https://raw.githubusercontent.com/christianb93/Kubernetes/master/network/service.yaml
$ kubectl apply -f https://raw.githubusercontent.com/christianb93/Kubernetes/master/network/nodePortService.yaml

When we now run kubectl get svc, we see that our service appears as a NodePort service, and, as the second entry in the columns PORTS, we find the port that Kubernetes opens for us.

$ kubectl get services
NAME             TYPE        CLUSTER-IP     EXTERNAL-IP   PORT(S)          AGE
alpine-service   NodePort    10.100.165.3           8080:32755/TCP   13s
kubernetes       ClusterIP   10.100.0.1             443/TCP          7h

In my case, the port 32755 has been used. If we now go back to one of the nodes and search the iptables rules for this port, we find that Kubernetes has created two additional NAT rules.

$ sudo iptables -S  -t nat | grep 32755
-A KUBE-NODEPORTS -p tcp -m comment --comment "default/alpine-service:" -m tcp --dport 32755 -j KUBE-MARK-MASQ
-A KUBE-NODEPORTS -p tcp -m comment --comment "default/alpine-service:" -m tcp --dport 32755 -j KUBE-SVC-SXWLG3AINIW24QJC

So we find that for all traffic directed to this port, again a marker is set and the rule KUBE-SVC-SXWLG3AINIW24QJC applies. If you inspect this rule, you will find that it is similar to the rules above and again realizes a load balancer that sends traffic to port 80 of one of the pods.

Let us now verify that we can really reach this pod from the outside world. Of course, this only works once we have allowed incoming traffic on at least one of the nodes in the respective AWS security group. The following commands determine the node Port, your IP address, the security group and the IP address of the node, allow access and submit the curl command (note that I use the cluster name myCluster to select the worker nodes, in case you are not using my scripts to run this example, you will have to change the filter to make this work).

$ nodePort=$(kubectl get svc alpine-service --output json | jq ".spec.ports[0].nodePort")
$ IP=$(aws ec2 describe-instances --filters Name=tag-key,Values=kubernetes.io/cluster/myCluster Name=instance-state-name,Values=running --output text --query Reservations[0].Instances[0].PublicIpAddress)
$ SEC_GROUP_ID=$(aws ec2 describe-instances --filters Name=tag-key,Values=kubernetes.io/cluster/myCluster Name=instance-state-name,Values=running --output text --query Reservations[0].Instances[0].SecurityGroups[0].GroupId)
$ myIP=$(wget -q -O- https://ipecho.net/plain)
$ aws ec2 authorize-security-group-ingress --group-id $SEC_GROUP_ID --port $nodePort --protocol tcp --cidr "$myIP/32"
$ curl $IP:$nodePort
<h1>It works!</h1>

Summary

After all these nitty-gritty details, let us summarize what we have found. When you start a pod on a node, a pair of virtual ethernet devices is created, with one end being assigned to the namespace of the container and one end being assigned to the namespace of the host. Then IP routes are added so that traffic directed towards the pod is forwarded to this bridge. This allows access to the container from the node on which they are running. To realize access from other nodes and pods and thus the flat Kubernetes networking model, EKS uses the AWS CNI plugin which attaches the pods IP addresses as secondary IP addresses to elastic network interfaces.

When you start a service, Kubernetes will in addition set up NAT rules that will capture traffic determined for the cluster IP address of the service and perform a destination network address translation so that this traffic gets send to one of the pods. The pod is selected at random, which implements a simple load balancer. For a service of type NodePort, additional rules will be created which make sure that the same NAT processing applies to traffic coming from the outside world.

This completes today post. If you want to learn more, you might want to check out some of the links below.

Kubernetes services and load balancers

In my previous post, we have seen how we can use Kubernetes deployment objects to bring up a given number of pods running our Docker images in a cluster. However, most of the time, a pod by itself will not be able to operate – we need to connect it with other pods and the rest of the world, in other words we need to think about networking in Kubernetes.

To try this out, let us assume that you have a cluster up and running and that you have submitted a deployment of two httpd instances in the cluster. To easily get to this point, you can use the scripts in my GitHub repository as follows. These scripts will also open two ssh connections, one to each of the EC2 instances which are part of the cluster (this assumes that you are using a PEM file called eksNodeKey.pem as I have done it in my examples, if not you will have to adjust the script up.sh accordingly).

# Clone repository
$ git clone https://github.com/christianb93/Kubernetes.git
$ cd Kubernetes/cluster
# Bring up cluster and two EC2 nodes
$ chmod 700 up.sh
$ ./up.sh
# Bring down nginx controller
$ kubectl delete svc ingress-nginx -n ingress-nginx
# Deploy two instances of the httpd
$ kubectl apply -f ../pods/deployment.yaml

Be patient, the creation of the cluster will take roughly 15 minutes, so time to get a cup of coffee. Note that we delete an object – the nginx ingress controller service – that my scripts generate and that we will use in a later post, but which blur the picture for today.

Now let us inspect our cluster and try out a few things. First, let us get the running pods.

$ kubectl get pods -o wide

This should give you two pods, both running an instance of the httpd. Typically, Kubernetes will distribute these two pods over two different nodes in the cluster. Each pod has an IP address called the pod IP address which is displayed in the column IP of the output. This is the IP address under which the pod is reachable from other pods in the cluster.

To verify this, let us attach to one of the pods and run curl to access the httpd running in the other pod. In my case, the first pod has IP address 192.168.232.210. We will attach to the second pod and verify that this address is reachable from there. To get a shell in the pod, we can use the kubectl exec command which executes code in a pod. The following commands extract the id of the second pod, opens a shell in this pod, installs curl and talks to the httpd in the first pod. Of course, you will have to replace the IP address of the first pod – 192.168.232.210 – with whatever your output gives you.

$ name=$(kubectl get pods --output json | \
             jq -r ".items[1].metadata.name")
$ kubectl exec -it $name "/bin/bash"
bash-4.4# apk add curl
bash-4.4# curl 192.168.232.210
<h1>It works!</h1>

Nice. So we can reach a port on pod A from any other pod in the cluster. This is what is called the flat networking model in Kubernetes. In this model, each pod has a separate IP address. All containers in the pod share this IP address and one IP namespace. Every pod IP address is reachable from any other pod in the cluster without a need to set up a gateway or NAT. Coming back to the comparison of a pod with a logical host, this corresponds to a topology where all logical hosts are connected to the same IP network.

In addition, Kubernetes assumes that every node can reach every pod as well. You can easily confirm this – if you log into the node (not the pod!) on which the second pod is running and use curl from there, directed to the IP address of the first pod, you will get the same result.

Now Kubernetes is designed to run on a variety of platforms – locally, on a bare metal cluster, on GCP, AWS or Azure and so forth. Therefore, Kubernetes itself does not implement those rules, but leaves that to the underlying platform. To make this work, Kubernetes uses an interface called CNI (container networking interface) to talk to a plugin that is responsible for executing the platform specific part of the network configuration. On EKS, the AWS CNI plugin is used. We will get into the details in a later post, but for the time being simply assume that this works (and it does).

So now we can reach every pod from every other pod. This is nice, but there is an issue – a pod is volatile. An application which is composed of several microservices needs to be prepared for the event that a pod goes down and is brought up again, be it due to a failure or simply due to the fact that an auto-scaler tries to empty a node. If, however, a pod is restarted, it will typically receive a different IP address.

Suppose, for instance, you had a REST service that you want to expose within your cluster. You use a deployment to start three pods running the REST service, but which IP address should another service in the cluster use to access it? You cannot rely on the IP address of individual pods to be stable. What we need is a stable IP address which is reachable by all pods and which routes traffic to one instance of this REST service – a bit like a cluster-internal load balancer.

Fortunately, Kubernetes services come to the rescue. A service is a Kubernetes object that has a stable IP address and is associated with a set of pods. When traffic is received which is directed to the service IP address, the service will select one of the pods (at random) and forward the traffic to it. Thus a service is a decoupling layer between the instable pod IP addresses and the rst of the cluster or the outer world. We will later see that behind the scenes, a service is not a process running somewhere, but essentially a set of smart NAT and routing rules.

This sounds a bit abstract, so let us bring up a service. As usual, a service object is described in a manifest file.

apiVersion: v1
kind: Service
metadata:
  name: alpine-service
spec:
  selector:
    app: alpine
  ports:
  - protocol: TCP
    port: 8080
    targetPort: 80

Let us call this file service.yaml (if you have cloned my repository, you already have a copy of this in the directory network). As usual, this manifest file has a header part and a specification section. The specification section contains a selector and a list of ports. Let us look at each of those in turn.

The selector plays a role similar to the selector in a deployment. It defines a set of pods that are assumed to be reachable via the service. In our case, we use the same selector as in the deployment, so that our service will send traffic to all pods brought up by this deployment.

The ports section defines the ports on which the service is listening and the ports to which traffic is routed. In our case, the service will listen for TCP traffic on port 8080, and will forward this traffic to port 80 on the associated pods (as specified by the selector). We could omit the targetPort field, in this case the target port would be equal to the port. We could also specify more than one combination of port and target port and we could use names instead of numbers for the ports – refer to the documentation for a full description of all configuration options.

Let us try this. Let us apply this manifest file and use kubectl get svc to list all known services.

$ kubectl apply -f service.yaml
$ kubectl get svc

You should now see a new service in the output, called alpine-service. Similar to a pod, this service has a cluster IP address assigned to it, and a port number (8080). In my case, this cluster IP address is 10.100.234.120. We can now again get a shell in one of the pods and try to curl that address

$ name=$(kubectl get pods --output json | \
             jq -r ".items[1].metadata.name")
$ kubectl exec -it $name "/bin/bash"
bash-4.4# apk add curl # might not be needed 
bash-4.4# curl 10.100.234.120:8080
<h1>It works!</h1>

If you are lucky and your container did not go down in the meantime, curl will already be installed and you can skip the apk add curl. So this works, we can actually reach the service from within our cluster. Note that we now have to use port 8080, as our service is listening on this port, not on port 80.

You might ask how we can get the IP address of the service in real world? Well, fortunately Kubernetes does a bit more – it adds a DNS record for the service! So within the pod, the following will work

bash-4.4# curl alpine-service:8080
<h1>It works!</h1>

So once you have the service name, you can reach the httpd from every pod within the cluster.

Connecting to services using port forwarding

Having a service which is reachable within a cluster is nice, but what options do we have to reach a cluster from the outside world? For a quick and dirty test, maybe the easiest way is using the kubectl port forwarding feature. This command allows you to forward traffic from a local port on your development machine to a port in the cluster which can be a service, but also a pod. In our case, let us forward traffic from the local port 5000 to port 8080 of our service (which is hooked up to port 80 on our pods).

$ kubectl port-forward service/alpine-service 5000:8080 

This will start an instance of kubectl which will bind to port 5000 on your local machine (127.0.0.1). You can now connect to this port, and behind the scenes, kubectl will tunnel the traffic through the Kubernetes master node into the cluster (you need to run this in a second terminal, as the kubectl process just started is still blocking your terminal).

$ curl localhost:5000
<h1>It works!</h1>

A similar forwarding can be realized using kubectl proxy, which is designed to give you access to the Kubernetes API from your local machine, but can also be used to access services.

Connect to a service using host ports

Forwarding is easy and a quick solution, but most likely not what you want to do in a production setup. What other options do we have?

One approach is to use host ports. Essentially, a host port is a port on a node that Kubernetes will wire up with the cluster IP address of a service. Assuming that you can reach the host from the outside world, you can then use the public IP address of the host to connect to a service.

To create a host port, we have to modify our manifest file slightly by adding a host port specification.

apiVersion: v1
kind: Service
metadata:
  name: alpine-service
spec:
  selector:
    app: alpine
  ports:
  - protocol: TCP
    port: 8080
    targetPort: 80
  type: NodePort

Note the additional line at the bottom of the file which instructs Kubernetes to open a node port. Assuming that this file is called nodePortService.yaml, we can again use kubectl to bring down our existing service and add the node port service.

$ kubectl delete svc alpine-service
$ kubectl apply -f nodePortService.yaml
$ kubectl get svc

We see that Kubernetes has brought up our service, but this time, we see two ports in the line describing our service. The second port (32226 in my case) is the port that Kubernetes has opened on each node. Traffic to this port will be forwarded to the service IP address and port. To try this out, you can use the following commands to get the external IP address of the first node, adapt the AWS security group such that traffic to this node is allowed from your workstation, determine the node port and curl it. If your cluster is not called myCluster, replace every occurrence of myCluster with the name of your cluster.

$ nodePort=$(kubectl get svc alpine-service --output json | jq ".spec.ports[0].nodePort")
$ IP=$(aws ec2 describe-instances --filters Name=tag-key,Values=kubernetes.io/cluster/myCluster Name=instance-state-name,Values=running --output text --query Reservations[0].Instances[0].PublicIpAddress)
$ SEC_GROUP_ID=$(aws ec2 describe-instances --filters Name=tag-key,Values=kubernetes.io/cluster/myCluster Name=instance-state-name,Values=running --output text --query Reservations[0].Instances[0].SecurityGroups[0].GroupId)
$ myIP=$(wget -q -O- https://ipecho.net/plain)
$ aws ec2 authorize-security-group-ingress --group-id $SEC_GROUP_ID --port $nodePort --protocol tcp --cidr "$myIP/32"
$ curl $IP:$nodePort
<h1>It works!</h1>

Connecting to a service using a load balancer

A node port will allow you to connect to a service using the public IP of a node. However, if you do this, this node will be a single point of failure. For a HA setup, you would typically choose a different options – load balancers.

Load balancers are not managed directly by Kubernetes. Instead, Kubernetes will ask the underlying cloud provider to create a load balancer for you which is then connected to the service – so there might be additional charges. Creating a service exposed via a load balancer is easy – just change the type field in the manifest file to LoadBalancer

apiVersion: v1
kind: Service
metadata:
  name: alpine-service
spec:
  selector:
    app: alpine
  ports:
  - protocol: TCP
    port: 8080
    targetPort: 80
  type: LoadBalancer

After applying this manifest file, it takes a few seconds for the load balancer to be created. Once this has been done, you can find the external DNS name of the load balancer (which AWS will create for you) in the column EXTERNAL-IP of the output of kubectl get svc. Let us extract this name and curl it. This time, we use the jsonpath option of the kubectl command instead of jq.

$ host=$(kubectl get svc alpine-service --output  \
         jsonpath="{.status.loadBalancer.ingress[0].hostname}")
$ curl $host:8080
<h1>It works!</h1>

If you get a “couldn not resolve hostname” error, it might be that the DNS entry has not yet propagated through the infrastructure, this might take a few minutes.

What has happened? Behind the scenes, AWS has created an elastic load balancer (ELB) for you. Let us describe this load balancer.

$ aws elb describe-load-balancers --output json
{
    "LoadBalancerDescriptions": [
        {
            "Policies": {
                "OtherPolicies": [],
                "LBCookieStickinessPolicies": [],
                "AppCookieStickinessPolicies": []
            },
            "AvailabilityZones": [
                "eu-central-1a",
                "eu-central-1c",
                "eu-central-1b"
            ],
            "CanonicalHostedZoneName": "ad76890d448a411e99b2e06fc74c8c6e-2099085292.eu-central-1.elb.amazonaws.com",
            "Subnets": [
                "subnet-06088e09ce07546b9",
                "subnet-0d88f92baecced563",
                "subnet-0e4a8fd662faadab6"
            ],
            "CreatedTime": "2019-03-17T11:07:41.580Z",
            "SecurityGroups": [
                "sg-055b253a63c7aba0a"
            ],
            "Scheme": "internet-facing",
            "VPCId": "vpc-060469b2a294de8bd",
            "LoadBalancerName": "ad76890d448a411e99b2e06fc74c8c6e",
            "HealthCheck": {
                "UnhealthyThreshold": 6,
                "Interval": 10,
                "Target": "TCP:30829",
                "HealthyThreshold": 2,
                "Timeout": 5
            },
            "BackendServerDescriptions": [],
            "Instances": [
                {
                    "InstanceId": "i-0cf7439fd8eb65858"
                },
                {
                    "InstanceId": "i-0fda48856428b9a24"
                }
            ],
            "SourceSecurityGroup": {
                "GroupName": "k8s-elb-ad76890d448a411e99b2e06fc74c8c6e",
                "OwnerAlias": "979256113747"
            },
            "DNSName": "ad76890d448a411e99b2e06fc74c8c6e-2099085292.eu-central-1.elb.amazonaws.com",
            "ListenerDescriptions": [
                {
                    "PolicyNames": [],
                    "Listener": {
                        "InstancePort": 30829,
                        "LoadBalancerPort": 8080,
                        "Protocol": "TCP",
                        "InstanceProtocol": "TCP"
                    }
                }
            ],
            "CanonicalHostedZoneNameID": "Z215JYRZR1TBD5"
        }
    ]
}

This is a long output, let us see what this tells us. First, there is a list of instances, which are the instances of the nodes in your cluster. Then, there is the block ListenerDescriptions. This block specificies, among other things, the load balancer port (8080 in our case, this is the port that the load balancer exposes) and the instance port (30829). You will note that these are also the ports that kubectl get svc will give you. So the load balancer will send incoming traffic on port 8080 to port 30829 of one of the instances. This in turn is a host port as discussed before, and therefore will be connected to our service. Thus, even though technically not fully correct, the following picture emerges (technically, a service is not a process, but a collection of iptables rules on each node, which we will look at in more detail in a later post).

LoadBalancerService

Using load balancers, however, has a couple of disadvantages, the most obvious one being that each load balancer comes with a cost. If you have an application that exposes tens or even hundreds of services, you clearly do not want to fire up a load balancer for each of them. This is where an ingress comes into play, which can distribute incoming HTTP(S) traffic across various services and which we will study in one of the next posts.

There is one important point when working with load balancer services – do not forget to delete the service when you are done! Otherwise, the load balancer will continue to run and create charges, even if it is not used. So delete all services before shutting down your cluster and if in doubt, use aws elb describe-load-balancers to check for orphaned load balancers.

Creating services in Python

Let us close this post by looking into how services can be provisioned in Python. First, we need to create a service object and populate its metadata. This is done using the following code snippet.

service = client.V1Service()
service.api_version = "v1"
service.kind = "Service"
metadata = client.V1ObjectMeta(name="alpine-service")
service.metadata = metadata
service.type="LoadBalancer"

Now we assemble the service specification and attach it to the service object.

spec = client.V1ServiceSpec()
selector = {"app": "alpine"}
spec.selector = selector
spec.type="LoadBalancer"
port = client.V1ServicePort(
              port = 8080, 
              protocol = "TCP", 
              target_port = 80 )
spec.ports = [port]
service.spec = spec

Finally, we authenticate, create an API endpoint and submit the creation request.

config.load_kube_config()
api = client.CoreV1Api()
api.create_namespaced_service(
         namespace="default", 
         body=service)

If you have cloned my GitHub repository, you will find a script network/create_service.py that contains the full code for this and that you can run to try this out (do not forget to delete the existing service before running this).