Understanding the Ethereum virtual machine – part II

In todays post, we will complete our understanding of how the EVM executes a smart contract. We will investigate the actual interpreter loop, discuss gas handling and have a short look at pre-compiled contracts.

The jump table and the main loop

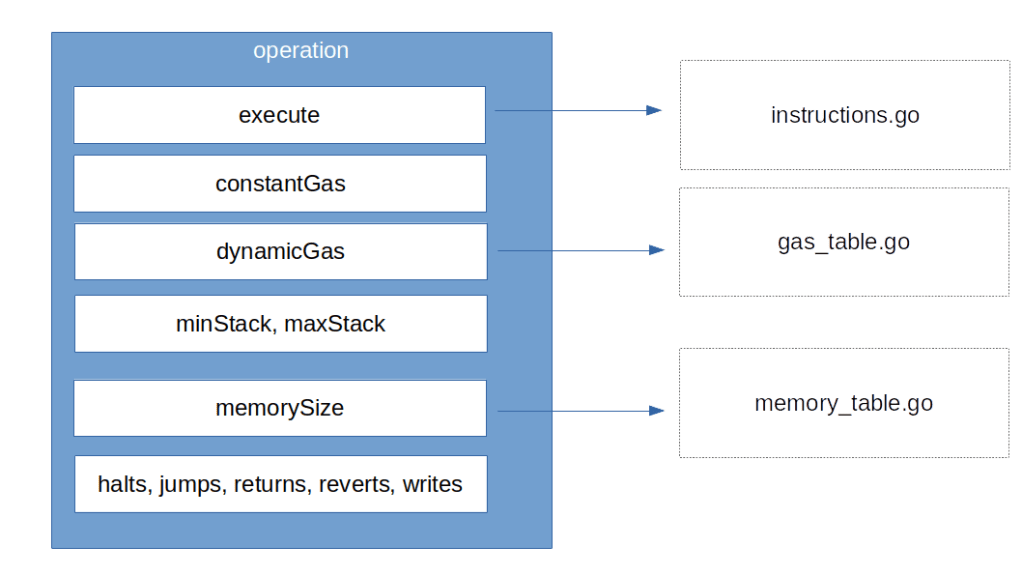
In the last post, we have seen that the entry point to the actual code execution is the Run method of the EVM interpreter. This method is essentially going through the bytecode step by step and, for each opcode, looking up the opcode in a data structure known as jump table– Among other things, this table contains a reference to a Go function that is to be executed to process the instruction. More specifically, an entry in the jump table contains the following fields, which partially refer to other tables in other source code files.

  • First, there is a Go function which is invoked to process the operation
  • Next, there is a gas value which is known as the constant gas cost of the operation. The idea behind this is that the gas cost for the execution of an instruction typically has two parts – a static part which is independent of the parameters and a dynamic part which depends on parameters like the memory consumption or other parameters. This field represents the static part
  • The third field is again a function that can be used to derive the dynamic part of the gas cost
  • The fourth field – minStack – is the number of stack items that this operation expects
  • The next field – maxStack – is the maximum size of the stack that will still allow this operation to work without overflowing the stack. For most operations, this is simply the maximum stack size minus the number of items that the operation pops from the stack plus the number of items that it adds to the stack
  • The next field, memorySize, specifies how much memory the opcode needs to execute. Again, this is a function, as the result could depend on parameters
  • The remaining fields are a couple of flags that describe the type of operation. The flag halts is set if the operation ends the execution of the code. At the time of writing, this is set for the opcodes STOP, RETURN and SELFDESTRUCT.
  • Similarly, the reverts flag indicates whether this opcode explicitly reverts the execution and is currently only set for the REVERT opcode itself
  • The return flag indicates whether this opcode returns any data. This is the case for the call operations STATICCALL, DELEGATECALL, CALL, and CALLCODE, but also for REVERT and contract creation via CREATE and CREATE2
  • The writes flag indicates whether the operation modifies the state and is set of operations like SSTORE
  • Finally, the jumps flag indicates whether the operation is a jump instruction and therefore modifies the program counter

Another data structure that will be important for the execution of the code is a set of fields known as the call context. This refers to a set of variables that make up the current of the interpreter and are reset every time a new execution starts, like memory, stack and the contract object.

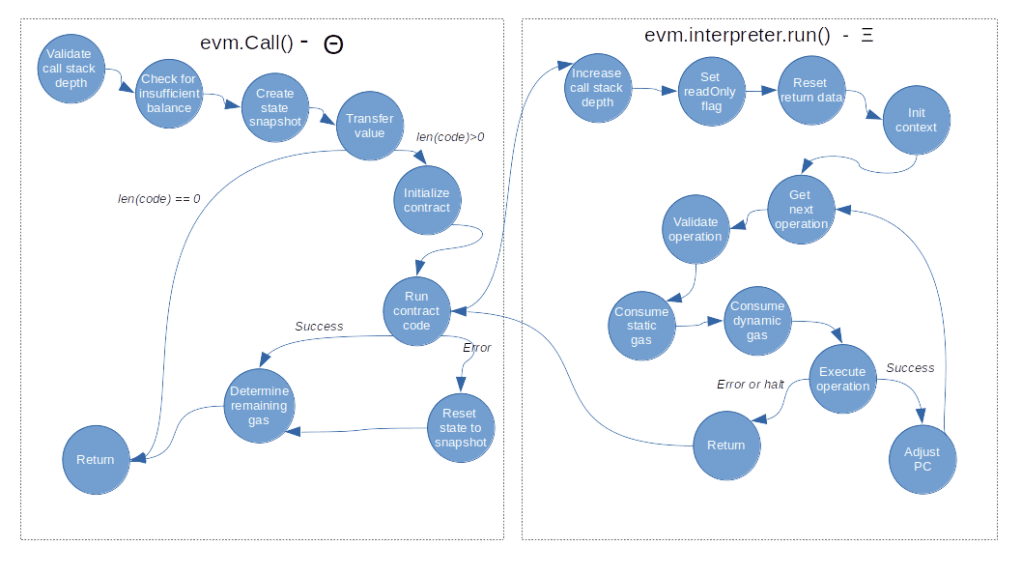
Let us now go through the Run method step by step and try to understand what it does. First, it increments the call stack depth which will be decremented again at the end of the function. It also sets the read only flag of the interpreter if not yet done and resets the return data field. Next, we initialize the call context and set the program counter to zero before we eventually enter a loop called the main loop.

Within this loop, we first check every 1000th step whether the abort flag is set. If yes, we stop execution (my understanding is that this feature is primarily used to cancel running EVM operations that were started as part of an API call). Next, we use the current value of the program counter to read the next opcode that we need to process, and look up that operation in the jump table (raising an error if there is no entry, which indicates an invalid opcode).

Once we have the jump table entry in our hands, we can now check the current stack size against the minimum and maximum stack size of the instruction and make sure that we raise an error if we try to process an operation in read-only mode that potentially updates the state.

We then calculate the gas required to perform the operation. As already explained, the gas consumption has two parts – a static part and a dynamic part. For each of these two contributions, we invoke the method UseGas() of the contract object, which will reduce the gas left that the contract tracks and also raise an error if we are running out of gas.

We then execute the operation by invoking the Go function to which it is mapped. This function will typically get some data from the stack, perform some calculations and push data back to the stack, but can also modify the state and perform more complex operations. Most if not all operations are contained in instructions.go, and it is instructive to scan the file and look at a few operations to get a feeling for how this works (we will go through a more complex example, the CALL operation, in a later post).

Once the instruction completes, we check the returns flag of the jump table entry to see whether the instruction returns any data, and if yes, we copy this data to the returnData field of the interpreter so that it is available for the next instruction. We then decide whether the execution is complete and we need to return to leave the main loop, or whether we need to continue execution with an updated program counter.

So the main loop is actually rather straightforward, and, together with our discussion of the Call() method in the previous post, we now have a fairly complete picture of how contract execution works.

Handling gas consumption

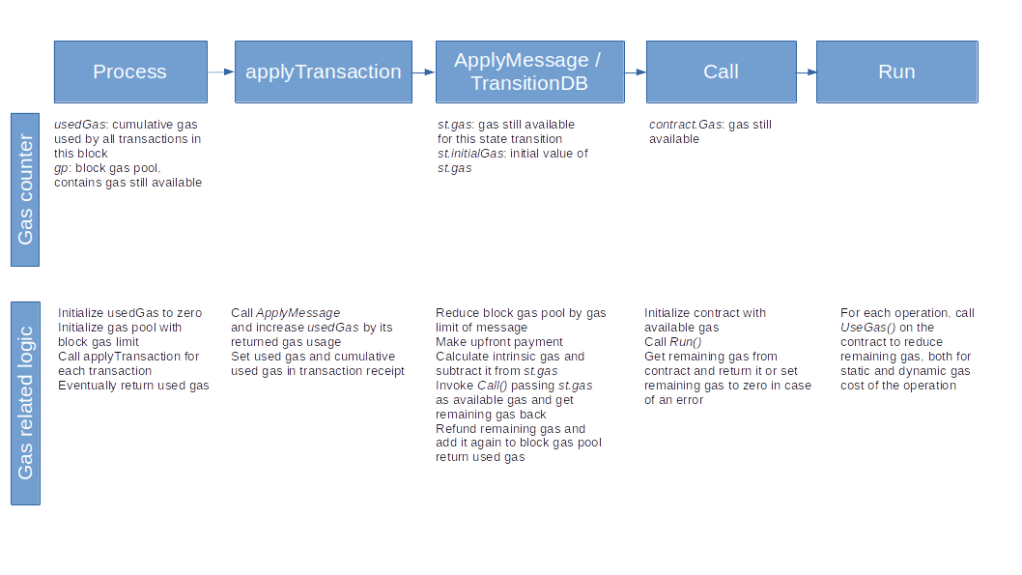
Let us leverage this end-to-end view to put together the various bits and pieces to understand how gas consumption is handled. We start our discussion on the level of an entire block. In one of the previous posts, we have already seen that when a block is processed here, two gas related variables are maintained. First, the processing keeps track of the gas used for all transactions in this block, which corresponds to the gasUsed field of a block header. In addition, there is a block gas pool, which is simply a counter initialized with the current block gas limit and used to keep track of the gas which is still available without violating this limit.

When we now process a single transaction contained in the block, we invoke the function applyTransaction. In this function, we increase the used gas counter on the block level by the gas consumed by the transaction and use that information to create the transaction receipt, that contains both the gas used by the transaction and the current value of the cumulative gas usage on the block level. This is done based on the return value of the ApplyMessage function, which itself immediately delegates to the TransitionDB method of a newly created state transition object.

The state transition object contains two additional gas counters. The first counter (st.gas) keeps track of the gas still available for this transaction, and is initialized with the gas limit of the transaction, so this is the equivalent of the gas pool on the block level. The second counter is the initial value of this field and only used to be able to calculate the gas actually used later on.

When we now process the transaction, we go through the following steps.

  • First, we initialize the gas counters
  • Then, we deduct the upfront payment from the senders balance. The upfront payment is the gas price times the gas limit and therefore the maximum amount of Ether that the sender might have to pay for this transaction
  • Similarly, we reduce the block gas limit by the gas limit of the transaction
  • Next, we calculate the intrinsic gas for the transaction. This is the amount of gas just for executing the plain transaction, still without taking any contract execution into account. It is calculated (ignoring contract creations) by taking a flat fee of currently 21000 units of gas per transaction, plus a fee for every byte of the transaction input (which is actually different for zero bytes and non-zero bytes). In addition, there is a fee for each entry in the access list (this is basically a list of accounts and addresses for which a discount applies when accessing them, see EIP-2930). In the yellow paper, the intrinsic gas is called g0 and defined in section 6.2
  • We then reduce the remaining gas by the intrinsic gas cost (again according to what section 6.2 of the yellow paper prescribes) and invoke Call(), using the remaining gas counter st.gas as the parameter which determines the gas available for this execution. Thus the gas available to the contract execution is the gas limit minus the intrinsic gas cost. We have already seen that this creates a Contract containing another gas counter which keeps track of the gas consumed during the execution. Within the interpreter main loop, we calculate static and dynamic gas cost for each opcode and reduce the counter accordingly. At the end, the remaining gas is returned
  • We update the remaining gas counter st.gas with the value returned by Call(). We then perform a refund, i.e. we the remaining gas times gas price back to the sender and also put the remaining gas back into the gas pool on block level

This has a few interesting consequences. First, it demonstrates that the total gas cost of executing a transaction does actually consist of two parts – the intrinsic gas for the transaction and the cost of executing the opcodes of the smart contract (if any). Both of these components have a static part (the 21000 base fee for the intrinsic gas cost and the static fee per opcode for the code execution) and a dynamic part, which depends on the transaction.

The second thing that you want to remember is that in order to make sure that a transaction is processed, it is not sufficient to have enough Ether to pay for the gas actually used. Instead, you need to have at least the gas limit times the gas price, otherwise the upfront payment will fail. Similarly, you need to make sure that the gas limit of your transaction is lower than the block gas limit, otherwise the block will not be mined.

Pre-compiled contracts

There is a special case of calling a contract that we have ignored so far – pre-compiled contracts. Before diving down into the code once more, let me quickly explain what pre-compiled contracts are and why they are useful.

Suppose you wanted to develop a smart contract that needs to calculate a hash value. The EVM has a built-in opcode SHA3 to calculate the Keccak hash, but what about other hashing algorithms? Of course, as the EVM is Turing-complete, you could develop a contract that does this, but this would blow up your contract considerably and, in addition, would probably be extremely slow as this would mean executing complex mathematical operations in the EVM. As an alternative, the Ethereum designers came up with the idea of a pre-compiled contract. Roughly speaking, this is a kind of extension of the instruction set of the EVM, realized as contracts located at pre-defined addresses. The contract at address 0x2, for instance, calculates an SHA256 hash, and the contract at address 0x3 a RIPEMD-160 hash. These contracts are, however, not really placed on the blockchain – if you look at the code at this address using for instance the JSON API method eth_getCode, you will not get anything back. Instead, these pre-defined contracts are handled by the EVM. If the EVM processes a CALL targeting one of these addresses, it does not actually call a contract at this address, but simply runs a native Go function that performs the required calculation.

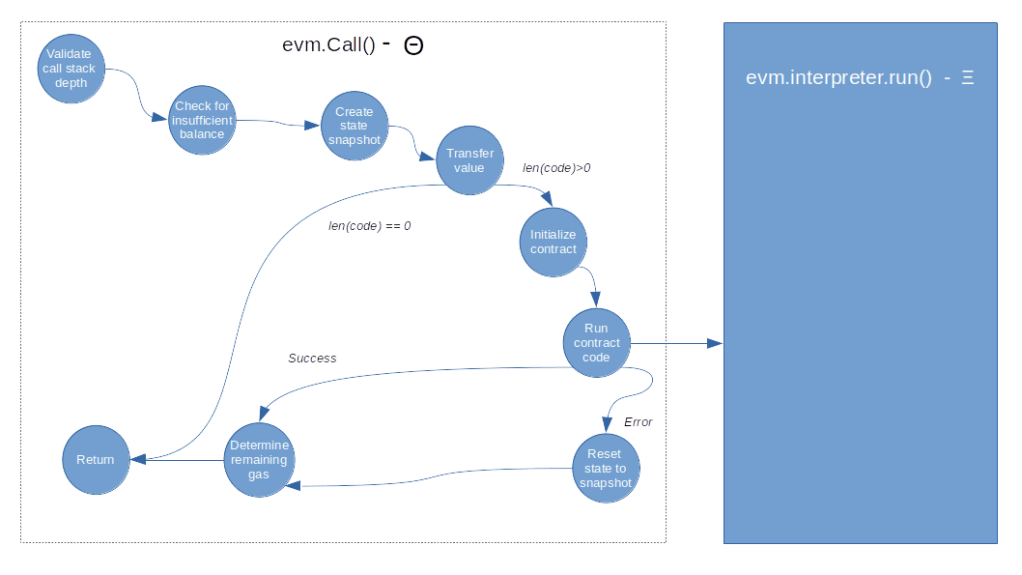
We have already seen where in the code this happens – when we initialize the target contract in the Call() method of the EVM, we check whether the target address is a pre-compiled contract and, if yes, execute the associated Go function instead of running the interpreter. The return values are essentially the same as for an ordinary call – return data, an error and the gas used for this operation.

The pre-compiled contracts as well as the gas cost for executing them are defined in the file contracts.go. At the time of writing, there are nine pre-compiled contracts, residing (virtually) at the addresses 0x1 to 0x9:

  • EC recover algorithm, which can be used to determine the public key of the signer of a transaction
  • SHA256 hash function
  • RIPEMD-160 hash function
  • the data copy function, which simply returns the input as output and can be used to copy large chunks of memory more efficiently than by using the built-in opcodes
  • exponentation module some number M
  • three elliptic curve operations to support zero-knowledge proofs (see the EIPs 196 and 197)
  • the BLAKE2 F compression function hash function (see EIP-152)

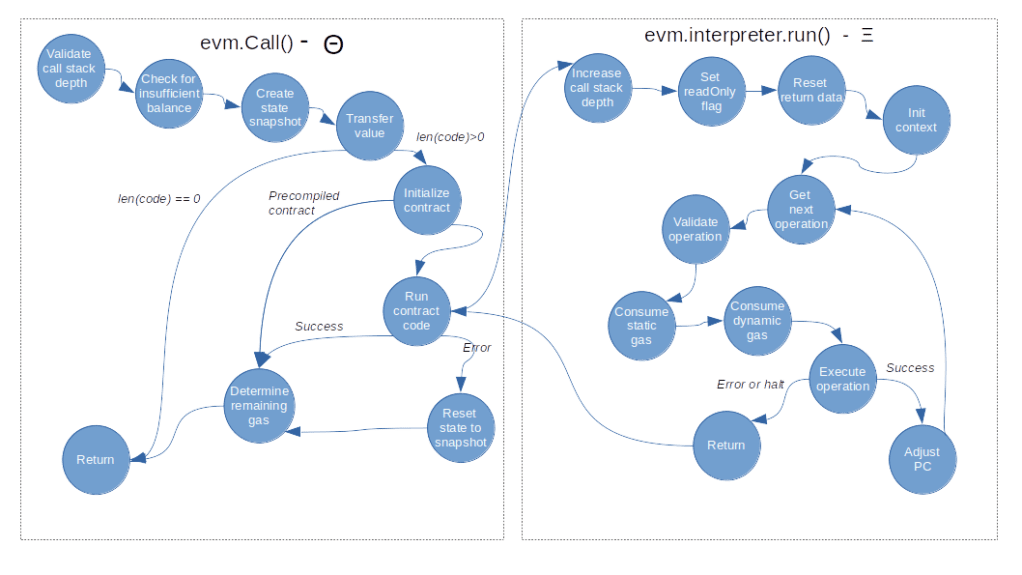
Here is the final flow diagram for the smart contract execution that now also reflects the special case of a pre-compiled contract.

With this, we close our post for today. In the next post, we will take a closer look at the CALL opcode and its variations to understand how a smart contract can invoke another contract.

Understanding the Ethereum virtual machine – part I

In todays post, we will shed some light on how the Ethereum virtual machine (EVM) actually works under the hood. We start with an overview of the most relevant data structures and methods and explain the big picture before we look at the interpreter main loop in the next post.

The Go-Ethereum EVM – an overview

To be able to analyze in depth what really happens if a specific opcode is executed, it is helpful to take a look at both the yellow paper and the source code of the Go-Ethereum (geth) client implementing what the yellow paper describes. The code for the EVM is in this folder (I have used version 1.10.6 for the analysis, but the structure should be rather stable across releases).

Let us first try to understand the data structures involved. The diagram below shows the most important classes, attributes and methods that we need to understand.

First, there is the block context. This class is simple, it simply contains some data fields that represent attributes of the block in which the transaction is located and is used to realize opcodes like NUMBER or DIFFICULTY. Similarly, the transaction context (TxContext) holds some fields of the transaction as part of which we execute the smart contract.

Let us now turn to the Contract class. The name of this class is a bit misleading, as it does in fact not represent a smart contract, but the execution of a smart contract, either as the result of a transaction or, more generally, of a message call. Its most important attributes (at least for our present discussion) are

  • The code, i.e. the smart contract code which is actually executed
  • the input provided
  • the gas available for the execution
  • the address at which the smart contract resides (self)
  • the address of the caller (caller and CallerAddress)

It is important to understand the meanings of the various addressed contained in this structure. First, there is the self attribute, which is the contract address, i.e. the address at which the contract itself resides. This is the address which is called Ia in the yellow paper, which is returned by the ADDRESS opcode and which is the address holding the state manipulated by the code, for instance when we run an SSTORE operation. This is also the address returned by the Address() method of the contract.

Next, there is the caller and the callerAddress. In most cases, these two addresses are identical and represent the source of the message call, i.e. what is called the sender Is in the yellow paper. There are cases, however, namely so called delegate calls, where these address are not identical. We will come back to this in the next post.

The contract object also maintains the gas available for the execution. This field is initialized when the the execution starts and can then be reduced by calling UseGas() to consume a certain amount of gas.

Next, there is the EVM itself. The EVM refers to a state (StateDB), a transaction context and a block context. It also holds an attribute abort which can be set to abort the execution, and a field callGasTemp which is used to hold the gas value in some cases, we will see this field in action later.

Finally, there is the EVM interpreter. The interpreter is doing all the hard work of running a piece of code. For that purpose, it references a jump table which is essentially a list of opcodes together with references to corresponding Go functions that need to be run whenever this opcode is encountered. The interpreter also maintains the scope context which is a structure bundling the data that is refreshed with every execution of a smart contract – the content of the memory, the content of the stack and the contract execution, represented by a contract object.

Code execution in the yellow paper

Before we move on to understand how the code execution actually works, let us take a short look at the yellow paper, in particular sections 6, 8 and 8 describing contract execution, and try to map the data structures and functions described there to the part of the source code that we have just explored.

The central function that describes the execution of a contract code in the yellow paper is a function denoted by a capital Theta (Θ) in the yellow paper. This function has the following arguments.

  • the state on which the code operates
  • the sender of the message call or transaction
  • the origin of the transaction (which is always an EOA and the address which signed the transaction)
  • the recipient of the message call
  • the address at which the code to be executed is located (this is typically the same as the recipient, but might again differ in the case of delegated calls)
  • the gas available for the execution
  • the gas price
  • the value to be transferred as part of the message call (again, there is a subtlety for delegate calls that we postpone to the next post)
  • the input data of the message call
  • the depth of the call stack
  • a flag that can be used to prevent the transaction from making any changes to the state (this is required for the STATICCALL functionality)

If you compare this list with the data structures displayed above, you will find that this is essentially the combination of the EVM attributes, the transaction context, the scope context and the contract execution object. All this data is tied together in the EVM class, so it is natural to assume that the function Θ itself is realized by a method of this class – in fact, this is the Call method that we will look at in the next section.

The output of Θ is the updated state, the remaining gas, an object known as accrued substate that contains touched and destroyed accounts, the logs generated during the execution and the gas to be refunded.

The inner workings of Θ are described in section 8 of the yellow paper, First, the value to be transferred is deducted from the balance of the sender and added to the balance of the recipient. Then, the actual code is executed – this happens by calling another function denoted by Ξ (a capital greek xi) – again, there is an exception to this rule for pre-compiled contracts that we discuss in the next post. If the execution is not succesful, then the state is reset to the its previous value, if it is successful, the state returned by Ξ is used. The function Ξ is again not terribly to identify in the source code – it is the method Run() of the EVM interpreter which will be the subject of the next post.

The call method of the EVM

Let us now take a closer look at the method Call() of the EVM which implements what the yellow paper calls Θ. The source code for this method can be found here. For today, I will ignore pre-compiled contracts completely which we will discuss in the next post.

The method starts by running a few checks, like making sure that we do not exceed the call depth limit (which is defined to be 1024 at the moment) or that we do not attempt to transfer more than the available balance.

The next step is to take a snapshot of the current state. Internally, Go-Ethereum uses revisions to keep track of different versions of the state, and taking a snapshot simply amounts to remembering a revision to which we can revert later if needed.

Next, we check whether the contract address already exists. This might be a bit confusing, as it does not seem to make sense to call a contract at a non-existing address, or, more precisely, at an address not yet initialized in the state DB. Note, however, that “calling” means a bit more general “sending a message to an account”, which is also done if you simply want to transfer Ether to an account. Sending a message to a non-contract account is perfectly valid, and it might even be that this account has never been used before and is therefore not part of the cached state.

The next step is to actually perform the transfer of any Ether involved in the message call, i.e. we send value Wei from the sender to the recipient. We then get into the actual bytecode execution by performing the following steps.

  • get the code associated with the contract address (i.e. the runtime bytecode) from the state
  • if the length of the code is zero, return – there is nothing left to be done
  • initialize a new Contract object that represents the current execution.
  • initialize the contract code
  • call the Run method of the interpreter

We then collect the return value from the Run method and a potential error code and set gas to contract.Gas – this represents the gas still remaining after executing the code. We then determine the final return values according to the following logic.

  • If Run did not result in an error, return the return value, error code and remaining gas just assembled
  • If Run returned a special error code indicating that the execution was reverted, reset the state to the previously created snapshot
  • If the error code returned by Run is not a reverted execution, also fall back to the snapshot but in addition, set the remaining gas to zero, i.e. such an error will consume all the available gas

Invocations of the call method

Having understood how Call works, we are now left with two tasks. First, we need to understand how the EVM interpreters Run method works, which will be the topic of our next post. Second, we have to learn where Call is actually invoked within the Go-Ethereum source code.

Not quite surprisingly, this happens at several points (ignoring tests). First, in a previous post, I have already shown you that the EVM’s Call method is invoked whenever a transaction is processed as part of a state transition. This call happens here, and the parameters are as we would expect – the the caller is the sender of the transaction, the contract address is the recipient, and the input data, gas and value are taken from the StateTransition object. The remaining gas returned is again stored in the state transition object and used as a basis for computing the gas refunded to the sender. Note that this entry point is (via the ApplyMessage function) also used by the JSON API when the eth_call method or the eth_estimateGas method are requested.

However, this is not the only point in the code where we find a reference to the Call method. A second point is actually the EVM interpreter itself, more precisely the function opCall in instructions.go. The background of this is at in addition to a call due to a transaction, i.e. a call initiated by an EOA, we can of course also call a smart contract from another smart contract using the CALL opcode. This opcode is implemented by the opCall function, and it turns out that it uses the EVM Call method as well. In this case, the parameters are taken from the stack respectively from the memory location referenced by the stack items.

  • the top level item on the stack is the gas that is made available (as we will see in the next post, this is not exactly true, but almost)
  • the next item on the stack is the target address
  • the third item is the value to be transferred
  • the next two items determine offset and length of the input data which is taken from memory
  • the last two items similarly determine offset and length of the return data area in memor

It is interesting to compare the handling of the returned error code. First, it is used to determine the status code that is returned. If there was an error, the status code is set to zero, otherwise it is set to one. Then, the returned data is stored in memory in case the execution was successful or explicitly reverted, for other errors no return data is passed. Finally, the unused gas is again returned to the currently executing contract.

This has an important consequence – there is no automatic propagation of errors in the EVM! If a contract A calls a contract B, and contract B reverts (either explicitly or due another error), then the call will technically go through, and contract A does not automatically revert as well. Instead, you will have to explicitly check the status code that the CALL opcode puts on the stack and handle the case that contract B fails somehow. Not doing this will make your contract vulnerable to the “King of the Ether” problem that we have discussed in my previous post on contract security.

Finally, scanning the code will reveal that there is a third point where the Call method is invoked – the EVM utility that allows you to run a specified bytecode outside of the Go-Ethereum client from the command line. It is fun to play with this, here is an example for its usage to invoke the sayHello method of our sample contract (again, assuming that you have cloned my repository for this series and are working in the root directory of the repository). Note that in order to install the evm utility, you will have to download the full geth archive, containing all the tools, and make the evm executable available in a folder in your path.

VERSION=$(python3 -c 'import solcx ; print(solcx.get_solc_version())')
DIR=$(python3 -c 'import solcx ; print(solcx.get_solcx_install_folder())')
SOLC="$DIR/solc-v$VERSION"
CODE=$($SOLC contracts/Hello.sol --bin-runtime   | grep "6080")
evm \
  --code $CODE\
  --input 0xef5fb05b \
  --debug run

This little experiment completes this post. In the next post, we will try to fill up the missing parts that we have not yet studied – how the code execution, i.e. the Run method, actually works, what pre-compiled contracts are and how gas is handled during the execution. We will also take a closer look at contract-to-contract calls and its variations.

Building a CI/CD pipeline for Kubernetes with Travis and Helm

One of the strengths of Kubernetes is the ability to spin up pods and containers with a defined workload within seconds, which makes it the ideal platform for automated testing and continuous deployment. In this, we will see how GitHub, Kubernetes, Helm and Travis CI play together nicely to establish a fully cloud based CI/CD pipeline for your Kubernetes projects.

Introduction

Traditional CI/CD pipelines require a fully equipped workstation, with tools like Jenkins, build environments, libraries, repositories and so forth installed on them. When you are used to working in a cloud based environment, however, you might be looking for alternatives, allowing you to maintain your projects from everywhere and from virtually every PC with a basic equipment. What are your options to make this happen?

Of course there many possible approaches to realize this. You could, for instance, maintain a separate virtual machine running Jenkins and trigger your builds from there, maybe using Docker containers or Kubernetes as build agents. You could use something like Gitlab CI with build agents on Kubernetes. You could install Jenkins X on your Kubernetes cluster. Or you could turn to Kubernetes native solutions like Argo or Tekton.

All these approaches, however, have in common that they require additional infrastructure, which means additional cost. Therefore I dediced to stick to Travis CI as a CI engine and control my builds from there. As Travis runs builds in a dedicated virtual machine, I can use kind to bring up a cluster for integration testing at no additional cost.

The next thing I wanted to try out is a multi-staged pipeline based on the GitOps approach. Roughly speaking, this approach advocates the use of several repositories, one per stage, which each reflect the actual state of the respective stage using Infrastructure-as-a-code. Thus, you would have one repository for development, one for integration testing and one for production (knowing, of course, that real organisations typically have additional stages). Each repository contains the configuration (like Kubernetes YAML files or other configuration items) for the respective Kubernetes cluster. At every point in time, the cluster state is fully in sync with the state of the repository. Thus, if you want to make changes to a cluster, you would not use kubectl or the API to directly deploy into the cluster and update your repository after the fact, but you would rather change the configuration of the cluster stored in the repository, and have a fully automated process in place which detects this change and updates the cluster.

The tool chain originally devised by the folks at Weaveworks requires access to a Kubernetes cluster, which, as described above, I wanted to avoid for cost reasons. Still, some of the basic ideas of GitOps can be applied with Travis CI as well.

Finally, I needed an example project. Of course, I decided to choose my bitcoin controller for Kubernetes, which is described in a series of earlier posts starting here.

Overall design and workflow

Based on these considerations, I came up with the following high-level design. The entire pipeline is based on three GitHub repositories.

  • The first repository, bitcoin-controller, represents the DEV stage of the project. It contains the actual source code of the bitcoin controller.
  • The second repository, bitcoin-controller-helm-qa, represents the QA stage. It does not contain source code, but a Helm chart that describes the state of the QA environment.
  • Finally, the third repository, bitcoin-controller-helm, represents a release of the production stage and contains the final, tested and released packaged Helm charts

To illustrate the overall pipeline, let us take a look at the image below.

CIPipeline

The process starts on the left hand side of the above diagram if a developer pushes a change into the DEV repository. At this point, the Travis CI process will start, spin up a virtual machine, install Go and required libraries and conduct build and unit test. Then, a Docker image is built and pushed into the Docker Hub image repository, using the Github commit as a tag. Finally, the new tag is written into the Helm chart stored in the QA repository so that the Helm chart points to the now latest version of the Docker image.

This change in the bitcoin-controller-helm-qa repository now triggers a second Travis CI pipeline. Once the virtual machine has been brought up by Travis, we install kind, spin up a Kubernetes cluster, install Helm in this cluster, download the current version of the Helm charts and install the bitcoin controller using this Helm chart. As we have previously updated the Docker tag in the Helm chart, this will pull the latest version of the Docker image.

We then run the integration tests against our newly established cluster. If the integration test succeeds, we package our Helm chart and upload them into the bitcoin-controller-helm repository.

However, we do not want to perform this last step for every single commit, but only for releases. To achieve this, we check at this point whether the commit was a tagged commit. If yes, a new package is built using the tag as version number. If not, the process stops at this point and no promote to the bitcoin-controller-helm-qa is executed.

Possible extensions

This simple approach can of course be extended into several directions. First, we could add an additional stage to also test our packaged Helm chart. In this stage, we would fully simulate a possible production environment, i.e. spin up a cluster at AWS, DigitalOcean or whatever your preferred provider is, deploy the packaged Helm chart and run additional tests. You could also easily integrate additional QS steps, like a performance test or static code analysis into this pipeline.

Some organisations like to add manual approval steps before deploying into production. Unfortunately, Travis CI does not seem to offer an easy solution for this. To solve this, one could potentially uses branches instead of tags to flag a certain code version as a release, and only allow specific users to perform a push or or merge into this branch.

Finally, we currently only store the Docker image which we then promote through the stages. This is fine for a simple project using Go, where there are no executables or other artifacts. For other projects, like a typical Java web application, you could use the same approach, but in addition store important artifacts like a WAR file in a separate repository, like Nexus or Artifactory.

Let us now dive into some more implementation details and pitfalls when trying to actually code this solution.

Build and deploy

Our pipeline starts when a developer pushes a code change into the DEV repository bitcoin-controller. At this point, Travis CI will step in and run our pipeline, according to the contents of the respective .travis.yml file. After some initial declarations, the actual processing is done by the stage definitions for the install, script and deploy phase.

install:
  - go get -d -t ./...

script:
  - go build ./cmd/controller/
  - go test -v  ./... -run "Unit" -count=1
  - ./travis/buildImage.sh

deploy:
  skip_cleanup: true
  provider: script
  script:  bash ./travis/deploy.sh
  on:
    all_branches: true

Let us go through this step by step. In the install phase, we run go get to install all required dependencies. Among other things, this will download the Kubernetes libraries that are needed by our project. Once this has been completed, we use the go utility to build and run the unit tests. We then invoke the script buildImage.sh.

The first part of the script is important for what follows – it determines the tag that we will be using for this build. Here are the respective lines from the script.

#
# Get short form of git hash for current commit
#
hash=$(git log --pretty=format:'%h' -n 1)
#
# Determine tag. If the build is from a tag push, use tag name, otherwise
# use commit hash
#
if [ "X$TRAVIS_TAG" == "X" ]; then
  tag=$hash
else
  tag=$TRAVIS_TAG
fi

Let us see how this works. We first use git log with the pretty format option to get the short form of the hash of the current commit (this works, as Travis CI will have checked out the code from Github and will have taken us to the root directory of the repository). We then check the environment variable TRAVIS_TAG which is set by Travis CI if the build trigger originates from pushing a tag to the server. If this variable is empty, we use the commit hash as our tag, and treat the build as an ordinary build (we will see later that this build will not make it into the final stage, but will only go through unit and integration testing). If the variable is not set, then we use the name of the tag itself.

The rest of the script is straighforward. We run a docker build using our tag to create an image locally, i.e. within the Docker instance of the Travis CI virtual machine used for the build. We also tag this image as latest to make sure that the latest tag does actually point to the latest version. Finally, we write the tag into a file for later use.

Now we move into the deploy stage. Here, we use the option skip_cleanup to prevent Travis from cleanup up our working directory. We then invoke another script deploy.sh. Here, we read the tag again from the temporary file that we have created during the build stage and push the image to the Docker Hub, using this tag once more.

#
# Login to Docker hub
#

echo "$DOCKER_PASSWORD" | docker login --username $DOCKER_USER --password-stdin

#
# Get tag
#
tag=$(cat $TRAVIS_BUILD_DIR/tag)

#
# Push images
#
docker push christianb93/bitcoin-controller:$tag
docker push christianb93/bitcoin-controller:latest

At this point, it is helpful to remember the use of image tags in Helm as discussed in one of my previous posts. Helm advocates the separation of charts (holding deployment information and dependencies) from configuration by moving the configuration into separate files (values.yaml) which are then merged back into the chart at runtime using placeholders. Applying this principle to image tags implies that we keep the image tag in a values.yaml file. To prepare for integration testing where we will use the Helm chart to deploy, we will now have to replace the tag name in this file by the current tag. So we need to check out our Helm chart using git clone and use our beloved sed to replace the image tag in the values file by its current value.

But this is not the only change that we want to make to our Helm chart. Remember that a Helm chart also contains versioning information – a chart version and an application version. However, at this point, we cannot simply use our tag anymore, as Helm requires that these version numbers follow the SemVer semantic versioning rules. So at this point, we need to define rules how we compose our version number.

We do this as follows. Every release receives a version number like 1.2, where the first digit is the major release and the second digit is the minor release. In GitHub, releases are created by pushing a tag, and the tag name is used as version number (and thus has to follow this convention). Development releases are marked by appending a hyphen followed by dev and the commit hash to the current version. So if the latest version is 0.9 and we create a new build with the commit hash 64ed033, the new version number will be 0.9-dev64ed033.

So we update the values file and the Helm chart itself with the new image tag and the new version numbers. We then push the change back into the Helm repository. This will trigger a second Travis CI pipeline and the integration testing starts.

PipelineDetailsPartOne

Integration testing

When the Travis CI pipeline for the repository bitcoin-helm-qa has reached the install stage, the first thing that is being done is to download the script setupVMAndCluster.sh which is located in the code repository and to run it. This script is responsible for executing the following steps.

  • Download and install Helm (from the snap)
  • Download and install kubectl
  • Install kind
  • Use kind to create a test cluster inside the virtual machine that Travis CI has created for us
  • Init Helm and wait for the Tiller container to be ready
  • Get the source code from the code repository
  • Install all required Go libraries to be ready for the integration test

Most of these steps are straightforward, but there are a few details which are worth being mentioned. First, this setup requires a significant data volume to be downloaded – the kind binary, the container images required by kind, Helm and so forth. To avoid that this slows down the build, we use the caching feature provided by Travis CI which allows us to cache the content of an arbitrary directory. If, for instance, we find that the kind node image is in the cache, we skip the download and instead use docker load to pre-load the image into the local Docker instance.

The second point to observe is that for integration testing, we need the code for the test cases which is located in the code repository, not in the repository for which the pipeline has been triggered. Thus we need to manually clone into the code repository. However, we want to make sure that we get the version of the test cases that matches the version of the Helm chart (which could, for instance, be an issue if someone changes the code repository while a build is in progress). Thus we need to figure out the git commit hash of the code version under test an run git checkout to use that version. Fortunately, we have put the commit hash as application version into the Helm chart while running the build and deploy pipeline, so we can use grep and awk to extract and use the commit hash.

tag=$(cat Chart.yaml | grep "appVersion:" | awk {' print $2 '})
cd $GOPATH/src/github.com/christianb93
git clone https://github.com/christianb93/bitcoin-controller
cd bitcoin-controller
git checkout $tag

Once this script has completed, we have a fully functional Kubernetes cluster with Helm and Tiller installed running in our VM. We can now use the Helm chart to install the latest version of the bitcoin controller and run our tests. Once the tests complete, we perform a cleanup and run an additional script (promote.sh) to enter the final stage of the build process.

This script updates the repository bitcoin-controller-helm that represents the Helm repository with the fully tested and released versions of the bitcoin controller. We first examine the tag to figure out whether this is a stable version, i.e. a tagged release. If this is not the case, the script completes without any further action.

If the commit is a release, we rename the directory in which our Helm chart is located (as Helm assumes that the name of the Helm chart and the name of the directory coincide) and update the chart name in the Chart.yaml file. We then remove a few unneeded files and use the Helm client to package the chart.

Next we clone into the bitcoin-controller-helm repository, place our newly packaged chart there and update the index. Finally, we push the changes back into the repository – and we are done.

PipelineDetailsPartTwo

Building a bitcoin controller for Kubernetes part IX – managing secrets and creating events

In the last post in this series, we have created a more or less functional bitcoin controller. However, to be reasonably easy to operate, there are still a few things that are missing. We have hardcoded secrets in our images as well as our code, and we log data, but do not publish events. These shortcomings are on our todo list for today.

Step 12: using secrets to store credentials

So far, we have used the credentials to access the bitcoin daemon at several points. We have placed the credentials in a configuration file in the bitcoin container where they are accessed by the daemon and the bitcoin CLI and we have used them in our bitcoin controller when establishing a connection to the RPC daemon. Let us now try to replace this by a Kubernetes secret.

We will store the bitcoind password and user in a secret and map this secret into the pods in which our bitcoind is running (thus the secret needs to be in the namespace in which the bitcoin network lives). The name of the secret will be configurable in the definition of the network.

In the bitcoind container, we add a startup script that checks for the existence of the environment variables. If they exist, it overwrites the configuration. It then starts the bitcoind as before. This makes sure that our image will still work in a pure Docker environment and that the bitcoin CLI can use the same passwords.

When our controller brings up pods, it needs to make sure that the secret is mapped into the environments of the pod. To do this, the controller needs to add a corresponding structure to the container specification when bringing up the pod, using the secret name provided in the specification of the bitcoin network. This is done by the following code snippet.

sts.Spec.Template.Spec.Containers[0].EnvFrom = []corev1.EnvFromSource{
	corev1.EnvFromSource{
		SecretRef: &corev1.SecretEnvSource{
			Optional: &optional,
			LocalObjectReference: corev1.LocalObjectReference{
				Name: bcNetwork.Spec.Secret,
			},
		},
	},
}

The third point where we need the secret is when the controller itself connects to a bitcoind to manage the node list maintained by the daemon. We will use a direct GET request to retrieve the secret, not an informer or indexer. The advantage of this approach is that in our cluster role, we can restrict access to a specific secret and do not have to grant the service account the right to access ANY secret in the cluster which would be an obvious security risk.

Note that the secret that we use needs to be in the same namespace as the pod into which it is mapped, so that we need one secret for every namespace in which a bitcoin network will be running.

Once we have the secret in our hands, we can easily extract the credentials from it. To pass the credentials down the call path into the bitcoin client, we also need to restructure the client a bit – the methods of the client now accept a full configuration instead of just an IP address so that we can easily override the default credentials. If no secret has been defined for the bitcoin network, we still use the default credentials. The code to read the secret and extract the credentials has been placed in a new package secrets.

Step 13: creating events

As a second improvement, let us adapt our controller so that it does not only create log file entries, but actively emits events that can be accessed using kubectl or the dashboard or picked up by a monitoring tool.

Let us take a quick look at the client-side code of the Kubernetes event system. First, it is important to understand that events are API resources – you can create, get, update, list, delete and watch them like any other API resource. Thus, to post an event, you could simply use the Kubernetes API directly and submit a POST request. However, the Go client package contains some helper objects that make it much easier to create and post events.

A major part of this mechanism is located in the tools/record package within the Go client. Here the following objects and interfaces are defined.

  • An event sink is an object that knows how to forward events to the Kubernetes API. Most of the time, this will be a REST client accessing the API, for instance the implementation in events.go in kubernetes/typed/core/v1.
  • Typically, a client does not use this object directly, but makes use of an event recorder. This is just a helper object that has a method Event that assembles an event and passes it to the machinery so that it will eventually be picked up by the recorder and sent to the Kubernetes API
  • The missing piece that connects and event sink and an event recorder is an event broadcaster. This is a factory class for event recorders. You can ask a broadcaster for a record and set up the broadcaster such that events received via this recorder are not only forwarded to the API, but also logged and forwarded to additional event handlers.
  • Finally, an event source is basically a label that is added to the events that we generate, so that whoever evaluates or reads the events knows where they originate from

Under the hood, the event system uses the broadcaster logic provided by the package apimachinery/pkg/watch. Here, a broadcaster is essentially a collection of channels. One channel, called the incoming channel, is used to collect messages, which are then distributed to N other channels called watchers. The diagram below indicates how this is used to manage events.

Broadcaster

When you create an event broadcaster, a watch.Broadcaster is created as well (embedded into the event broadcaster), and when you ask this broadcaster to create a new recorder, it will return a recorder which is connected to the same watch.Broadcaster. If a recorder publishes an event, it will write into the incoming queue of this broadcaster, which then distributes the event to all registered watchers. For each watcher, a new goroutine is started with invokes a defined function once an event is received. This can be a function to perform logging, but also be a function to write into an event sink.

To use this mechanism, we therefore have to create an event broadcaster, an event source, an event sink, register potentially needed additional handlers and finally receive a recorder. The Kubernetes sample controller again provides a good example how this is done.

After adding a similar code to our controller, we will run into two small problems. First, events are API resources, and therefore our controller needs the right to create them. So once more, we need to adapt our cluster role to grant that right. The second problem that we can get is that the event refers to a bitcoin network, but is published via the core Kubernetes API. The scheme used for that purpose is not aware of the existence of bitoin network objects, and the operation will fail, resulting in the mesage ‘Could not construct reference to …due to: ‘no kind is registered for the type v1.BitcoinNetwork in scheme “k8s.io/client-go/kubernetes/scheme/register.go:65″‘. To fix this, we can simply add our scheme to the default scheme (as it is also done in the sample controller

This completes todays post. In the next post, we will discuss how we can efficiently create and run automated unit and integration tests for our controller and mock the Kubernetes API.

Playing with Travis CI

You are using Github to manage your open source projects and want a CI/CD pipeline, but do not have access to a permanently available private infrastructure? Then you might want to take a look at hosted CI/CD platforms like Bitbucket pipelines, Gitlab, CircleCI – or Travis CI

When I was looking for a cloud-based integration platform for my own projects, I decided to give Travis CI a try. Travis offers builds in virtual machines, which makes it much easier to spin up local Kubernetes clusters with e.g. kind for integration testing, offers unlimited free builds for open source projects, is fully integrated with Github and makes setting up standard builds very easy – of course more sophisticated builds require more work. In this post, I will briefly describe the general usage of Travis CI, while a later post will be devoted to the design and implementation of a sample pipeline integrating Kubernetes, Travis and Helm.

Introduction to Travis CI

Getting started with Travis is easy, assuming that you already have a Github account. Simply navigate to the Travis CI homepage, sign up with your Github account and grant the required authorizations to Travis. You can then activate Travis for your Github repositories individually. Once Travis has been enabled for a repository, Travis will create a webhook so that every commit in the repository triggers a build.

For each build, Travis will spin up a virtual machine. The configuration of this machine and the subsequent build steps are defined in a file in YAML format called .travis.yml that needs to be present in the root directory of the repository.

Let us look at a very simple example to see how this works. As a playground, I have created a simple sample repository that contains a “Hello World” implementation in Go and a corresponding unit test. In the root directory of the repository, I have placed a file .travis.yml with the following content.

language: go
dist: xenial

go:
  - 1.10.8

script:
  - go build
  - go test -v -count=1

This is file in YAML syntax, defining an associative array, i.e. key/value pairs. Here, we see four keys: language, dist, go and script. While the first three keys define settings (the language to use, the base image for the virtual machine that Travis will create and the Go version), the fourth key is a build phase and defines a list of commands which will be executed during the build phase. Each of these commands can be an ordinary command as you would place it in a shell script, in particular you can invoke any program or shell script you need.

To see this in action, we can now trigger a test build in Travis. There are several options to achieve this, I usually place a meaningless text file somewhere in the repository, change this file, commit and push to trigger a build. When you do this and wait for a few minutes, you will see a new build in your Travis dashboard. Clicking on this build takes you to the build log, which is displayed on a screen similar to the following screenshot.

TravisBuild

Working your way through this logfile, it becomes pretty transparent what Travis is doing. First, it will create a virtual machine for the build, using Ubuntu Xenial (16.04) as a base system (which I did select using the dist key in the Travis CI file). If you browse the system information, you will see some indications that behind the scenes, Travis is using Googles Cloud Platform GCP to provision the machine. Then, a Go language environment is set up, using Go 1.10.8 (again due to the corresponding setting in the Travis CI file), and the repository that triggered the build is cloned.

Once these steps have been completed, the Travis engine processes the job in several phases according to the Travis lifecycle model. Not all phases need to be present in the Travis CI file, if a phase is not specified, default actions are taken. In our case, the install phase is not defined in the file, so Travis executes a default script which depends on the programming language and in our case simply invokes go get.

The same holds for the build phase. Here, we have overwritten the default action for the build phase using the script tag in the Travis CI file. This tag is a YAML formatted list of commands which will be executed step by step during the build phase. Each of these commands can indicate failure by returning a non-zero exit code, but still, all commands will be executed even if one of the previous commands has failed – this is important to understand when designing your build phase. Alternatively, you could of course place your commands in a shell script and use for instance set -e to make sure that the script fails if one individual step fails.

A more complex job will usually have additional phases after the build phase, like a deploy phase. The commands in the deploy phase are only executed once your build phase completes successfully and are typically used to deploy a “green” build into the next stage.

Environment variables and secrets

During your build, you will typically need some additional information on the build context. Travis offers a couple of mechanisms to get access to that information.

First, there are of course environment variables that Travis will set for you. It is instructive to study the source code of the Travis build system to see where these variables are defined – like builtin.rb or several bash scripts like travis_export_go or travis_setup_env. Here is a list of the most important environment variables that are available.

  • TRAVIS_TMPDIR is pointing to a temporary directory that your scripts can use
  • TRAVIS_HOME is set to the home directory of the travis user which is used for running the build
  • TRAVIS_TAG is set only if the current build is for a git tag, if this is the case, it will contain the tag name
  • TRAVIS_COMMIT is the full git commit hash of the current build
  • TRAVIS_BUILD_DIR is the absolute path name to the directory where the Git checkout has been done to and where the build is executed

In addition to these built-in variables, users have several options to declare environment variables on top. First, environment variables can be declared using the env tag in the Travis CI file. Note that Travis will trigger a build for each individual item in this list, with the environment variables set to the values specified in this line. Thus if you want to avoid additional builds, specify all environment variables in one line like this.

env:
  - FOO=foo BAR=bar

Now suppose that during your build, you want to push a Docker image into your public repository, or you want to publish an artifact on your GitHub page. You will then need access to the respective credentials. Storing these credentials as environment variables in the Travis CI file is a bad idea, as anybody with read access to your Github repository (i.e. the world) can read your credentials. To handle this use case, Travis offers a different option. You can specify environment variables on the repository level in the Travis CI web interface, which are then available to every build for this repository. These variables are stored in encrypted form and – assuming that you trust Travis – appear to be reasonably safe (when you use Travis, you have to grant them privileged access to your GitHub repository anyway, so if you do not trust them, you might want to think about a privately hosted CI solution).

TravisRepositorySettings

Testing a build configuration locally

One of the nice things with Travis is that the source code of the build system is publicly available on GitHub, along with instructions on how to use it. This is very useful if you are composing a Travis CI file and run into errors which you might want to debug locally.

As recommended in the README of the repository, it is a good idea to do this in a container. I have turned the build instructions on this page into a Dockerfile that is available as a gist. Let us use this and the Travis CI file from my example repository to dive a little bit into the inner workings of Travis.

For that purpose, let us first create an empty directory, download the Docker file and build it.

$ mkdir ~/travis-test
$ cd ~/travis-test
$ wget https://gist.githubusercontent.com/christianb93/e14252a122d081a219b84a905a40543f/raw/1525fec3b26c7dc4eab71e7838c02f8637e40675/Dockerfile.travis-build
$ docker build --tag travis-build --file Dockerfile.travis-build .

Next, clone my test repository and run the container, mounting the current directory as a bind mount on /travis-test

$ git clone --depth=1 https://github.com/christianb93/go-hello-world
$ docker run -it -v $(pwd):/travis-test travis-build

You should now see a shell prompt within the container, with a working directory containing a clone of the travis build repository. Let us grab our Travis CI file and copy it to the working directory.

# cp /travis-test/go-hello-world/.travis.yml .

When Travis starts a build, it internally converts the Travis CI file into a shell script. Let us do this for our sample file and take quick look a the resulting shell script. Within the container, run

# bin/travis compile > /travis-test/script

The compile command will create the shell script and print it to standard output. Here, we redirect this back into the bind mount to have it on the host where you can inspect it using your favorite code editor. If you open this script, you will see that it is in fact a bash script that first defines some of the environment variables that we have discussed earlier. It then defines and executes a function called travis_preamble and then prints a very long string containing some function definitions into a file called job_stages which is then sourced, so that these functions are available. A similar process is then repeated several times, until finally, at the end of the script, a collection of these functions is executed.

Actually running this script inside the container will fail (the script expects some environment that is not present in our container, it will for instance probe a specific URL to connect to the Travis build system), but at least the script job_stages will be created and can be inspected. Towards the end of the script, there is one function for each of the phases of a Travis build job, and starting with these functions, we could now theoretically dive into the script and debug our work.

Caching with Travis CI

Travis runs each job in a new, dedicated virtual machine. This is very useful, at it gives you a completely reproducable and clean build environment, but also implies that it is difficult to cache results during builds. Go, for instance, maintains a build cache that significantly reduces build times and that is not present by default during a build on Travis. Dependencies are also not cached, meaning that they have to be downloaded over and over again with each new build.

To enable caching, a Travis CI file can contain a cache directive. In addition to a few language specific options, this allows you to specify a list of directories which are cached between builds. Behind the scenes, Travis uses a caching utility which will store the content of the specified directories in a cloud object store (judging from the code, this is either AWS S3 or Google’s GCS). At the end of a build, the cached directories are scanned and if the content has changed, a new archive is created and uploaded to the cloud storage. Conversely, when a job is started, the archive is downloaded and unzipped to create the cached directories. Thus we learn that

  • The cached content still needs to be fetched via the network, so that caching for instance a Docker image is not necessarily faster than pulling the image from the Docker Hub
  • Whenever something in the cached directories changes, the entire cache is rebuilt and uploaded to the cloud storage

These characteristics imply that caching just to avoid network traffic will usually not work – you should cache data to avoid repeated processing of the same data. In my experience, for instance, caching the Go build cache is really useful to speed up builds, but caching Docker images (by exporting them into an archive which is then placed in a cached directory) can actually be slower than downloading the images again for each build.

Using the API to inspect your build results

So far, we have operated Travis through the web interface. However, to support full automation, Travis does of course also offer an API.

To use the API, you will first have to navigate to your profile and retrieve an API token. For the remainder of this section, I will assume that you have done this and defined an environment variable travisToken that contains this token. The token needs to be present in the authorization header of each HTTPS request that goes to the API.

To test the API and the token, let us first get some data on our user using curl. So in a terminal window (in which you have exported the token) enter

$ curl -s\
  -H "Travis-API-Version: 3"\
  -H "Authorization: token $travisToken" \
  https://api.travis-ci.org/user | jq

As a result, you should see a JSON formatted output that I do not reproduce here for privacy reasons. Among other fields, you should be able to see your user ID, both as a string and an integer, as well as your Github user ID, demonstrating that the token works and is associated with your credentials.

As a different and more realistic example, let us suppose that you wanted to retrieve the state of the latest build for the sample repository go-hello-world. You would then navigate from the repository, identified by its slug (i.e. the combination of Github user name and repository), to its builds, sort the builds by start date and use jq to retrieve the status of the first entry in the list.

$ curl -s\
    -H "Travis-API-Version: 3"\
    -H "Authorization: token $travisToken" \
    "https://api.travis-ci.org/repo/christianb93%2Fgo-hello-world/builds?limit=5&sort_by=started_at:desc" \
     | jq -r '.builds[0].state'

Note that we need to properly format the backslash which is part of the URL and need to include the entire URL in double quotes so that the shell does not interpret the ampersand & as an instruction to spawn curl in the background.

There is of course much more that you can do with the API – you can activate and deactivate repositories, trigger and cancel builds, retrieve environment variables, change repository settings and so forth. Instead of using the API directly with curl, you could also use the official Travis client which is written in Ruby, and it would probably not be very difficult to create a simple library accessing that API in any other programming language.

We have reached the end of this short introduction to Travis CI. In one of the next posts, I will show you how to actually put this into action. We will build a CI pipeline for my bitcoin controller which fully automates unit and integration tests using Helm and kind to spin up a local Kubernetes cluster. I hope you enjoyed this post and come back to read more soon.

Building a bitcoin controller for Kubernetes part VII – testing

Kubernetes controllers are tightly integrated with the Kubernetes API – they are invoked if the state of the cluster changes, and they act by invoking the API in turn. This tight dependency turns testing into a challenge, and we need a smart testing strategy to be able to run unit and integration tests efficiently.

The Go testing framework

As a starting point, let us recall some facts about the standard Go testing framework and see what this means for the organization of our code.

A Go standard installation comes with the package testing which provides some basic functions to define and execute unit tests. When using this framework, a unit test is a function with a signature

func TestXXX(t *testing.T)

where XXX is the name of your testcase (which, ideally, should of course reflect the purpose of the test). Once defined, you can easily run all your tests with the command

$ go test ./...

from the top-level directory of your project. This command will scan all packages for functions following this naming convention and invoke each of the test functions. Within each function, you can use the testing.T object that can be used to indicate failure and log error messages. At the end of a test execution, a short summary of passed and failed tests will be printed.

It is also possible to use go test to create and display a coverage analysis. To do this, run

$ go test ./... -coverprofile /tmp/cp.out
$ go tool cover -html=/tmp/cp.out

The first command will execute the tests and write coverage information into /tmp/cp.out. The second command will turn the contents of this file into HTML output and display this nicely in a browser, resulting in a layout as below (and yes, I understand that test coverage is a flawed metric, but still it is useful….)

GoTestCoverage

How do we utilize this framework in our controller framework? First, we have to decide in which packages we place the test functions. The Go documentation recommends to place the test code in the same package as the code under test, but I am not a big fan of this approach, because this will allow you to access private methods and attributes of the objects under test and not to test against contracts, but against implementation. Therefore I have decided to put the code for unit testing a package XYZ into a dedicated package XYZ_test (more on integration tests below).

This approach has its advantages, but requires that you take testability into account when designing your code (which, of course, is a good idea anyway). In particular, it is good practice to use interfaces to allow for injection of test code. Let us take the code for the bitcoin RPC client as an example. Here, we use an interface HTTPClient to model the dependency of the RPC client from a HTTP clent. This interface is implemented by the client from the HTTP package, but for testing purposes, we can use a mock implementation and inject it when creating a bitcoin RPC client.

We also have to think about separation of unit tests which will typically use mock objects from integration tests that require a running Kubernetes cluster or a bitcoin daemon. There are different ways to do this, but the approach that I have chosen is as follows.

  • Unit tests are placed in the same directory as the code that they test
  • A unit test functions has a name that ends with “Unit”
  • Integration tests – which typically test the system as a whole and thus are not clearly linked to an individual package – are placed in a global subdirectory test
  • Integration test function names end on “Integration”

With this approach, we can run all unit tests by executing

go test ./... -run "Unit"

from the top-level directory, and can use the command

go test -run "Integration"

from within the test directory to run all integration tests.

The Kubernetes testing package

To run useful unit tests in our context, we typically need to simulate access to a Kubernetes API. We could of course our own mock objects, but fortunately, the Kubernetes client go package comes with a set of ready-to-use helper objects to do this. The core of this is the package client-go/testing. The key objects and concepts used in this package are

  • An action describes an API call, i.e. a HTTP request against the Kubernetes API, by defining the namespace, the HTTP verb and the resource and subresource that is addressed
  • A Reactor describes how a mock object should react to a particular action. We can ask a Reactor whether it is ready to handle a specific action and then invoke its React action to actually do this
  • A Fake object is essentially a collection of actions recording the actions that have been taken on the mock object and reactors that react upon these actions. The core of the Fake object is its Invoke method. This method will first record the action and then walk the registered reactors, invoking the first reactor that indicates that it will handle this action and returning its result

This is of course rather a framework than a functional mock object, but the client-go library offers more – it has a generated set of fake client objects that build on this logic. In fact, there is a fake clientset in the package client-go/kubernetes/fake which implements the kubernetes.Interface interface that makes up a Kubernetes API client. If you take a look at the source code, you will find that the implementation is rather straightforward – a fake clientset embeds a testing.Fake object and a testing.ObjectTracker which is essentially a simple object store. To link those two elements, it installs reactors for the various HTTP verbs like GET, UPDATE, … that simply carry out the respective action on the object tracker. When you ask such a fake clientset for, say, a Nodes object, you will receive an object that delegates the various methods like Get to the invoke method of the underlying fake object which in turn uses the reactors to get the result from the object tracker. And, of course, you can add your own reactors to simulate more specific responses.

KubernetesTesting

Using the Kubernetes testing package to test our bitcoin controller

Let us now discuss how we can use that testing infrastructure provided by the Kubernetes packages to test our bitcoin controller. To operate our controller, we will need the following objects.

  • Two clientsets – one for the standard Kubernetes API and one for our custom API – here we can utilize the machinery described above. Note that the Kubernetes code generators that we use also creates a fake clientset for our bitcoin API
  • Informer factories – again there will be two factories, one for the Kubernetes API and one for our custom API. In a fully integrated environment these informers would invoke the event handlers of the controller and maintain the cache. In our setup, we do not actually run the controller, but only use the cache that they contain, and maintain the cache ourselves. This gives us more control about the contents of the cache, the timing and the invocations of the event handlers.
  • A fake bitcoin client that we inject into the controller to simulate the bitcoin RPC server

Its turns out to be useful to collect all components that make up this test bed in a Go structure testFixture. We can then implement some recurring functionality like the basic setup or starting and stopping the controller as methods of this object.

TestFixture

In this approach, there is a couple of pitfalls. First, it is important to keep the informer caches and the state stored in the fake client objects in sync. If, for example, we let the controller add a new stateful set, it will do this via the API, i.e. in the fake clientset, and we need to push this stateful set into the cache so that during the next iteration, the controller can find it there.

Another challenge is that our controller uses go routines to do the actual work. Thus, whenever we invoke an event handler, we have to wait until the worker thread has picked up the resulting queued event before we can validate the results. We could do this by simply waiting for some time, however, this is of course not really reliable and can lead to long execution times. Instead, it is a better approach to add a method to the controller which allows us to wait until the controller internal queue is empty and makes the tests deterministic. Finally, it is good practice to put independent tests into independent functions, so that each unit test function starts from scratch and does not rely on the state left over by the previous function. This is especially important because go test will cache test results and therefore not necessarily execute all test cases every time we run the tests.

Integration testing

Integration testing does of course require a running Kubernetes cluster, ideally a cluster that can be brought up quickly and can be put into a defined state before each test run. There are several options to achieve this. Of course, you could make use of your preferred cloud provider to bring up a cluster automatically (see e.g. this post for instructions on how to do this in Python), run your tests, evaluate the results and delete the cluster again.

If you prefer a local execution, there are by now several good candidates for doing this. I have initially executed integration tests using minikube, but found that even though this does of course provide perfect isolation, it has the disadvantage that starting a new minikube cluster takes some time, which can slow down the integration tests considerably. I have therefore switched to kind which runs Kubernetes locally in a Docker container. With kind, a cluster can be started in approximately 30 seconds (depending, of course, on your machine). In addition, kind offers an easy way to pre-load docker images into the nodes, so that no download from Docker hub is needed (which can be very slow). With kind, the choreography of a integration test run is roughly as follows.

  • Bring up a local bitcoin daemon in Docker which will be used to test the Bitcoin RPC client which is part of the bitcoin controller
  • Bring up a local Kubernetes cluster using kind
  • Install the bitcoin network CRD, the RBAC profile and the default secret
  • Build the bitcoin controller and a new Docker image and tag it in the local Docker repository
  • Pre-load the image into the nodes
  • Start a pod running the controller
  • Pre-pull the docker image for the bitcoin daemon
  • Run the integration tests using go test
  • Tear down the cluster and the bitcoin daemon again

I have created a shell script that runs these steps automatically. Currently, going through all these steps takes about two minutes (where roughly 90 seconds are needed for the actual tests and 30 seconds for setup and tear-down). For the future, I plan to add support for microk8s as well. Of course, this could be automated further using a CI/CD pipeline like Jenkins or Travis CI, with proper error handling, a clean re-build from a freshly cloned repo and more reporting functionality – this is a topic that I plan to pick up in a later post.

Building a bitcoin controller for Kubernetes part V – establishing connectivity

Our bitcoin controller now has the basic functionality that we expect – it can synchronize the to-be state and the as-is state and update status information. However, to be really useful, a few things are still missing. Most importantly, we want our nodes to form a real network and need to establish a mechanism to make them known to each other. Specifically, we will use RPC calls to exchange IP addresses between the nodes in our network so that they can connect.

Step 10: talking to the bitcoin daemon

To talk to the bitcoin daemon, we will use its JSON RPC interface. We thus need to be able to send and receive HTTP POST requests and to serialize and de-serialize JSON. Of course there are some libraries out there that could do this for us, but it is much more fun to implement our own bitcoin client in Go. For that purpose, we will use the packages HTTP and JSON.

While developing this client, it is extremely useful to have a locally running bitcoind. As we already have a docker image, this is very easy – simply run

$ docker run -d -p 18332:18332 christianb93/bitcoind

on your local machine (assuming you have Docker installed). This will open port 18332 which you can access using for instance curl, like

$ curl --user 'user:password' --data '{"jsonrpc":"1.0","id":"0","method":"getnetworkinfo","params":[]}' -H 'content-type:text/plain;' http://localhost:18332

Our client will be very simple. Essentially, it consists of the following two objects.

  • A Config represents the configuration data needed to access an RPC server (IP, port, credentials)
  • A BitcoinClient which is the actual interface to the bitcoin daemon and executes RPC calls

A bitcoin client holds a reference to a configuration which is used as default if no other configuration is supplied, and a HTTP client. Its main method is RawRequest which creates an RPC request, adds credentials and parses the response. No error handling to e.g. deal with timeouts is currently in place (this should not be a real restriction in practice, as we have the option to re-queue our processing anyway). In addition to this generic function which can invoke any RPC method, there are specific functions like AddNode, RemoveNode and GetAddedNodeList that accept and return Go structures instead of JSON objects. In addition, there are some structures to model RPC request, RPC responses and errors.

BitcoinClient

Node that our controller now needs to run inside the cluster, as it needs to access the bitcoind RPC servers (there might be ways around this, for instance by adding a route on the host similar to what minikube tunnel is doing for services, but I found that this is easily leads to IP range conflicts with e.g. Docker).

Step 11: adding new nodes to our network

When we bring up a network of bitcoin nodes, each node starts individually, but is not connected to any other node in the network – in fact, if we bring up three nodes, we maintain three isolated blockchains. For most use cases, this is of course not what we want. So let us now try to connect the nodes to each other.

To do this, we will manipulate the addnode list that each bitcoind maintains. This list is like a database of known nodes to which the bitcoind will try to connect. Before we automate this process, let us first try this out manually. Bring up the network and enter

$ ip1=$(kubectl get bitcoinnetwork my-network -o json | jq -r ".status.nodes[1].ip")
$ kubectl exec my-network-sts-0 -- /usr/local/bin/bitcoin-cli -regtest -conf=/bitcoin.conf addnode $ip1 add

This will find out the (node) IP address of the second node using our recently implemented status information and invoke the JSON-RPC method addnode on the first node to connect the first and the second node. We can now verify that the IP address of node 1 has been added to the addnode list of node 0 and that node 1 has been added to the peer list of node 0, but also node 0 has been added to the peer list of node 1.

$ kubectl exec my-network-sts-0 -- /usr/local/bin/bitcoin-cli -regtest -conf=/bitcoin.conf getaddednodeinfo
$ kubectl exec my-network-sts-0 -- /usr/local/bin/bitcoin-cli -regtest -conf=/bitcoin.conf getpeerinfo
$ kubectl exec my-network-sts-1 -- /usr/local/bin/bitcoin-cli -regtest -conf=/bitcoin.conf getpeerinfo

We can now repeat this process with the third node – we again make the node known to node 0 and then get the list of nodes each nodes knows about.

$ ip2=$(kubectl get bitcoinnetwork my-network -o json | jq -r ".status.nodes[2].ip")
$ kubectl exec my-network-sts-0 -- /usr/local/bin/bitcoin-cli -regtest -conf=/bitcoin.conf addnode $ip2 add
$ kubectl exec my-network-sts-0 -- /usr/local/bin/bitcoin-cli -regtest -conf=/bitcoin.conf getpeerinfo
$ kubectl exec my-network-sts-1 -- /usr/local/bin/bitcoin-cli -regtest -conf=/bitcoin.conf getpeerinfo
$ kubectl exec my-network-sts-2 -- /usr/local/bin/bitcoin-cli -regtest -conf=/bitcoin.conf getpeerinfo

We see that

  • Node 0 knows both node 1 and node 2
  • Node 1 knows only node 0
  • Node 2 knows only node 1

So in contrast to my previous understanding, the nodes do not automatically connect to each other when there is a node that is known to all of them. After some research, I suspect that this is because bitcoind puts addresses into buckets and only connects to one IP address in the bucket. As IP addresses in the same subnet go into the same bucket, only one connection will be made by default. To avoid an artificial dependency on node 0, we therefore explicitly connect each node to any other node in the network.

To do this, we create an additional function syncNodes which is called during the reconciliation if we detect a change in the node list. Within this function, we then simply loop over all nodes that are ready and, for each node:

  • Submit the RPC call addednodeinfo to get a list of all nodes that have previously been added
  • For each node that is not in the list, add it using the RPC call addnode with command add
  • For each node that is in the list, but is no longer ready, use the same RPC call with command remove to remove it from the list

As there might be another worker thread working on the same network, we ignore, for instance, errors that a bitcoind returns when we try to add a node that has already been added before, similarly for deletions.

Time again to run some tests. First, let us run the controller and bring up a bitcoin network called my-network (assuming that you have cloned my repository)

$ kubectl apply -f deployments/controller.yaml
$ kubectl apply -f deployments/testNetwork.yaml

Wait for some time – somewhere between 30 and 45 seconds – to allow all nodes to come up. Then, inspect the log file of the controller

$ kubectl logs bitcoin-controller -n bitcoin-controller

You should now see a few messages indicating that the controller has determined that nodes need to be added to the network. To verify that this worked, we can print all added node lists for all three instances.

$ for i in {0..2}; 
do
  ip=$(kubectl get pod my-network-sts-$i -o json  | jq -r ".status.podIP")
  echo "Connectivity information for node $i (IP $ip):" 
  kubectl exec my-network-sts-$i -- /usr/local/bin/bitcoin-cli -regtest -conf=/bitcoin.conf getaddednodeinfo | jq -r ".[].addednode"
done

This should show you that in fact, all nodes are connected to each other – each node is connected to all other nodes. Now let us connect to one node, say node 0, and mine a few blocks.

$ kubectl exec my-network-sts-0 -- /usr/local/bin/bitcoin-cli -regtest -conf=/bitcoin.conf generate 101

After a few seconds, we can verify that all nodes have synchronized the chain.

$ for i in {0..2}; 
do
  ip=$(kubectl get pod my-network-sts-$i -o json  | jq -r ".status.podIP")
  blocks=$(kubectl exec my-network-sts-$i -- /usr/local/bin/bitcoin-cli -regtest -conf=/bitcoin.conf getblockchaininfo | jq -r ".blocks")
  echo "Node $i (IP $ip) has $blocks blocks" 
done

This should show you that all three nodes have 101 blocks in their respective chain. What happens if we bring down a node? Let us delete, for instance, pod 0.

$ kubectl delete pod my-network-sts-0

After a few seconds, the stateful set controller will have brought up a replacement. If you wait for a few more seconds and repeat the command above, you will see that the new node has been integrated into the network and synchronized the blockchain. In the logfiles of the controller, you will also see that two things have happened (depending a bit on timing). First, the controller has realized that the node is no longer ready and uses RPC calls to remove it from the added node lists of the other nodes. Second, when the replacement node comes up, it will add this node to the remaining nodes and vice versa, so that the synchronization can take place.

Similarly, we can scale our deployment. To do this, enter

$ kubectl edit bitcoinnetwork my-network

Then change the number of replicas to four and save the file. After a few seconds, we can inspect the state of the blockchain on the new node and find that is also has 101 blocks.

$ kubectl exec my-network-sts-3 -- /usr/local/bin/bitcoin-cli -regtest -conf=/bitcoin.conf getblockchaininfo

Again, the log files of the controller tell us that the controller has detected the new node and added it to all other nodes. Similarly, if we use the same procedure to scale down again, the nodes that are removed from the stateful set will also be removed from the added node lists of the remaining nodes.

We now have the core functionality of our controller in place. As in the previous posts, I have pushed the code into a new tag on GitHub. I have also pushed the latest image to Docker Hub so that you can repeat the tests described above without building the image yourself. In the next post, we will start to add some more meat to our controller and to implement some obvious improvements – proper handling of secrets, for instance.

Building a bitcoin controller for Kubernetes part IV – garbage collection and status updates

In our short series on implementing a bitcoin controller for Kubernetes, we have reached the point where the controller is actually bringing up bitcoin nodes in our network. Today, we will extend its logic to also cover deletions and we will start to add additional logic to monitor the state of our network.

Step 9: owner references and deletions

As already mentioned in the last post, Kubernetes has a built-in garbage collector which we can utilize to handle deletions so that our controller does not have to care about this.

The Kubernetes garbage collector is essentially a mechanism that is able to perform cascading deletes. Let us take a deployment as an example. When you create a deployment, the deployment will in turn create a replica set, and the replica set will bring up pods. When you delete the deployment, the garbage collector will make sure that the replica set is deleted, and the deletion of the replica set in turn will trigger the deletion of the pods. Thus we only have to maintain the top-level object of the hierarchy and the garbage collector will help us to clean up the dependent objects.

The order in which objects are deleted is controller by the propagation policy which can be selected when deleting an object. If “Foreground” is chosen, Kubernetes will mark the object as pending deletion by setting its deletionTimestamp and delete all objects that are owned by this object in the background before itself is eventually removed. For a “Background” deletion, the order is reversed – the object will be deleted right away, and the cleanup will be performed afterwards.

How does the garbage collector identify the objects that need to be deleted when we delete, say, a deployment? The ownership relation underlying this logic is captured by the ownership references in the object metadata. This structure contains all the information (API version, kind, name, UID) that Kubernetes needs to identify the owner of an object. An owner reference can conveniently be generated using the function NewControllerRef in the package k8s.io/apimachinery/pkg/apis/meta/v1

Thus, to allow Kubernetes to clean up our stateful set and the service when we delete a bitcoin network, we need to make two changes to our code.

  • We need to make sure that we add the owner reference to the metadata of the objects that we create
  • When reconciling the status of a bitcoin network with its specification, we should ignore networks for which the deletion timestamp is already set, otherwise we would recreate the stateful set while the deletion is in progress

For the sake of simplicity, we can also remove the delete handler from our code completely as it will not trigger any action anyway. When you now repeat the tests at the end of the last post and delete the bitcoin, you will see that the stateful set, the service and the pods are deleted as well.

At this point, let us also implement an additional improvement. When a service or a stateful set changes, we have so far been relying on the periodic resynchronisation of the cache. To avoid long synchronization times, we can also add additional handlers to our code to detect changes to our stateful set and our headless service. To distinguish changes that affect our bitcoin networks from other changes, we can again use the owner reference mechanism, i.e. we can retrieve the owner reference from the stateful set to figure out to which – if any – bitcoin network the stateful set belongs. Following the design of the sample controller, we can put this functionality into a generic method handleObject that works for all objects.

BitcoinControllerStructureII

Strictly speaking, we do not really react upon changes of the headless service at the moment as the reconciliation routine only checks that it exists, but not its properties, so changes to the headless service would go undetected at the moment. However, we add the event handler infrastructure for the sake of completeness.

Step 10: updating the status

Let us now try to add some status information to our bitcoin network which is updated regularly by the controller. As some of the status information that we are aiming at is not visible to Kubernetes (like the synchronization state of the blockchain), we will not add additional watches to capture for instance the pod status, but once more rely on the periodic updates that we do anyway.

The first step is to extend the API type that represents a bitcoin network to add some more status information. So let us add a list of nodes to our status. Each individual node is described by the following structure

type BitcoinNetworkNode struct {
	// a number from 0...n-1 in a deployment with n nodes, corresponding to
	// the ordinal in the stateful set
	Ordinal int32 `json:"ordinal"`
	// is this node ready, i.e. is the bitcoind RPC server ready to accept requests?
	Ready bool `json:"ready"`
	// the IP of the node, i.e. the IP of the pod running the node
	IP string `json:"ip"`
	// the name of the node
	NodeName string `json:"nodeName"`
	// the DNS name
	DNSName string `json:"dnsName"`
}

Correspondingly, we also need to update our definition of a BitcoinNetworkStatus – do not forget to re-run the code generation once this has been done.

type BitcoinNetworkStatus struct {
	Nodes []BitcoinNetworkNode `json:"nodes"`
}

The next question we have to clarify is how we determine the readiness of a bitcoin node. We want a node to appear as ready if the bitcoind representing the node is accepting JSON RPC requests. To achieve this, there is again a Kubernetes mechanism which we can utilize – readiness probes. In general, readiness probes can be defined by executing an arbitrary command or by running a HTTP request. As we are watching a server object, using HTTP requests seems to be the way to go, but there is a little challenge: the bitcoind RPC server uses HTTP POST requests, so we cannot use a HTTP GET request as a readiness probe, and Kubernetes does not allow us to configure a POST request. Instead, we use the exec-option of a readiness check and run the bitcoin CLI inside the container to determine when the node is ready. Specifically, we execute the command

/usr/local/bin/bitcoin-cli -regtest -conf=/bitcoin.conf getnetworkinfo

Here we use the configuration file that contains, among other things, the user credentials that the CLI will use. As a YAML structure, this readiness probe would be set up as follows (but of course we do this in Go in our controller programmatically).

   readinessProbe:
      exec:
        command:
        - /usr/local/bin/bitcoin-cli
        - -regtest
        - -conf=/bitcoin.conf
        - getnetworkinfo
      failureThreshold: 3
      initialDelaySeconds: 10
      periodSeconds: 10
      successThreshold: 1
      timeoutSeconds: 1

Note that we wait 10 seconds before doing the first probe, to give the bitcoind sufficient time to come up. It is instructive to test higher values of this, for instance 60 seconds – when the stateful set is created, you will see how the creation of the second pod is delayed for 60 seconds until the first readiness check for the first pod succeeds.

Now let us see how we can populate the status structure. Basically, we need to retrieve a list of all pods that belong to our bitcoin network. We could of course again use the ownership references to find those pods, or use the labels that we need anyway to define our stateful set. But in our case, there is even a an easier approach – as we use a stateful set, the names of the pods are completely predictable and we can easily retrieve them all by name. So to update the status information, we need to

  • Loop through the pods controlled by this stateful set, and for each pod
  • Find the status of the pod, using its conditions
  • Retrieve the pods IP address from its status
  • Assemble the DNS name (which, as we know, is the combination of the name of the pod and the name of the headless service)
  • Put all this into the above structure
  • Post this using the UpdateStatus method of our client object

Note that at this point, we follow the recommended best practise and update the status independent of the spec. It is instructive to extend the logging of the controller to log the generation of the bitcoin network and the resourceVersion. The generation (contained in the ObjectMeta structure) represents a version of the desired state, i.e. the spec, and is only updated (usually incremented by one) if we change the spec for the bitcoin network resource. In contrast to this, the resource version is updated for every change of the persisted state of the object and represents the etcd’s internal sequence number.

When you try to run our updated controller inside the cluster, however, you will find that there is again a problem – with the profile that we have created and to which our service account is linked, the update of the status information of a bitcoin network is not allowed. Thus we have to explicitly allow this by granting the update right on the subresource status, which is done by adding the following rule to our cluster role.

- apiGroups: ["bitcoincontroller.christianb93.github.com"]
  resources: ["bitcoinnetworks/status"]
  verbs: ["update"] 

We can now run a few more tests to see that our status updates work. When we bring up a new bitcoin network and use kubectl with “-o json” to retrieve the status of the bitcoin network, we can see that the node list populates as the pods are brought up and the status of the nodes changes to “Ready” one by one.

I have again created a tag v0.4 in the GitHub repository for this series to persist the state of the code at this point in time, so that you have the chance to clone the code and play with it. In the next post, we will move on and add the code needed to make sure that our bitcoin nodes detect each other at startup and build a real bitcoin network.

Building a bitcoin controller for Kubernetes part II – code generation and event handling

In this post, we will use the Kubernetes code generator to create client code and informers which will allow us to set up the basic event handlers for our customer controller.

Before we start to dig into this, note that compared to my previous post, I had to make a few changes to the CRD definition to avoid dashes in the name of the API group. The updated version of the CRD definition looks as follows.

apiVersion: apiextensions.k8s.io/v1beta1
kind: CustomResourceDefinition
metadata:
    name: bitcoinnetworks.bitcoincontroller.christianb93.github.com
spec:
    version: v1
    group: bitcoincontroller.christianb93.github.com
    scope: Namespaced
    subresources:
      status: {}
    names:
      plural: bitcoinnetworks
      singular: bitcoinnetwork
      kind: BitcoinNetwork
    validation:
      openAPIV3Schema:
        properties:
          spec:
            required:
            - nodes
            properties:
              nodes:
                type: integer

Step 5: running the code generators

Of course we will use the Kubernetes code generator to generate the code for the clientset and the informer. To use the code generator, we first need to get the corresponding packages from the repository.

$ go get k8s.io/code-generator
$ go get k8s.io/gengo

The actual code generation takes place in three steps. In each step, we will invoke one of the Go programs located in $GOPATH/src/k8s.io/code-generator/cmd/ to create a specific set of objects. Structurally, these programs are very similar. They accept a parameter that specifies certain input packages that are scanned. They then look at every structure in these packages and detect tags, i.e. comments in a special format, to identify those objects for which they need to create code. Then they place the resulting code in an output package that we need to specify.

Fortunately, we only need to prepare three inputs files for the code generation – the first one is actually scanned by the generators for tags, the second and third file have to be provided to make the generated code compile.

  • In the package apis/bitcoincontroller/v1, we need to provide a file types.go in which define the Go structures corresponding to our CRD – i.e. a BitcoinNetwork, the corresponding list type BitcoinNetworkList, a BitcoinNetworkSpec and a BitcoinNetworkStatus. This is also the file in which we need to place our tags (as the scan is based on package structures, we could actually call our file however we want, but following the usual conventions makes it easier for third parties to read our code)
  • In the same directory, we will place a file register.go. This file defines some functions that will later be called by the generated code to register our API group and version with a scheme
  • Finally, there is a second file register.go which is placed in apis/bitcoincontroller and defines a constant representing the fully qualified name of the API group

We first start with the generator that creates the code to create deep copies for our API objects. In this case, we mark the structures for which code should be generated with the tag +k8s.deepcopy-gen=true (which we could also do on package level). As we also want to create DeepCopyObject() methods for these structures, we also add the additional tags

+k8s:deepcopy-gen:interfaces=k8s.io/apimachinery/pkg/runtime.Object

Then we invoke the code generator using

go run $GOPATH/src/k8s.io/code-generator/cmd/deepcopy-gen/main.go \
  --bounding-dirs github.com/christianb93/bitcoin-controller/internal/apis \
  --input-dirs github.com/christianb93/bitcoin-controller/internal/apis/bitcoincontroller/v1

By default, the generator will place its results in a file deepcopy_generated.go in the input directory. If you run the controller and open the file, you should find the generated code which is not hard to read and does in fact simply create deep copies. For a list, for instance, it creates a new list and copies item by item. As our structures are not deeply nested, the code is comparatively straightforward. If something goes wrong, you can add the switch --v 5 to increase the log level and obtain additional debugging output.

The second code generator that we will use is creating the various clients that we need – a clientset for our new API group and a client for our new resource. The structure of the command is similar, but this time, we place the generated code in a separate directory.

go run $GOPATH/src/k8s.io/code-generator/cmd/client-gen/main.go \
  --input-base "github.com/christianb93/bitcoin-controller/internal/apis" \
  --input "bitcoincontroller/v1" \
  --output-package "github.com/christianb93/bitcoin-controller/internal/generated/clientset" \
  --clientset-name "versioned"

The first two parameters taken together define the package that is scanned for tagged structures. This time, the magic tag that will cause a structure to be considered for code generation is +genclient. The third parameter and the fourth parameters similarly define where the output will be placed in the Go workspace. The actual package name will be formed from this output path by appending the name of the API group and the version. Make sure to set this variable, as the default will point into the Kubernetes package and not into your own code tree (it took me some time to figure out the exact meaning of all these switches and a few failed attempts plus some source code analysis – but this is one of the beauties of Go – all the source code is at your fingertip…)

When you run this command, it will place a couple of files in the directory $GOPATH/src/github.com/christianb93/bitcoin-controller/internal/generated/clientset. With these files, we have now all the code in place to handle our objects via the API – we can create, update, get and list our bitcoin networks. To list all existing bitcoin networks, for instance, the following code snippet will work (I have skipped some of the error handling code to make this more readable).

import (
	"fmt"
	"path/filepath"

	bitcoinv1 "github.com/christianb93/bitcoin-controller/internal/apis/bitcoincontroller/v1"
	clientset "github.com/christianb93/bitcoin-controller/internal/generated/clientset/versioned"
	"k8s.io/client-go/tools/clientcmd"
	"k8s.io/client-go/util/homedir"
)

home := homedir.HomeDir()
kubeconfig := filepath.Join(home, ".kube", "config")
config, err := clientcmd.BuildConfigFromFlags("", kubeconfig)
// Create BitcoinNetwork client set
c, err := clientset.NewForConfig(config)
client := c.BitcoincontrollerV1()
list, err := client.BitcoinNetworks("default").List(metav1.ListOptions{})
for _, item := range list.Items {
	fmt.Printf("Have item %s\n", item.Name)
}

This code is very similar to the code that we have used in one of our first examples to list pods and nodes, with the only difference that we are now using our generated packages to create a clientset. I have written a few tests to verify that the generated code works.

To complete our code generation, we now have to generate listers and informers. The required commands will first generate the listers package and then the informers package that uses the listers.

go run $GOPATH/src/k8s.io/code-generator/cmd/lister-gen/main.go \
  --input-dirs  "github.com/christianb93/bitcoin-controller/internal/apis/bitcoincontroller/v1"\
  --output-package "github.com/christianb93/bitcoin-controller/internal/generated/listers"

go run $GOPATH/src/k8s.io/code-generator/cmd/informer-gen/main.go \
  --input-dirs  "github.com/christianb93/bitcoin-controller/internal/apis/bitcoincontroller/v1"\
  --versioned-clientset-package "github.com/christianb93/bitcoin-controller/internal/generated/clientset/versioned"\
  --listers-package "github.com/christianb93/bitcoin-controller/internal/generated/listers"\
  --output-package "github.com/christianb93/bitcoin-controller/internal/generated/informers"

You can find a shell script that runs all necessary commands here.

Again, we can now use our listers and informers as for existing API objects. If you want to try this out, there is also a small test set for this generated code.

Step 6: writing the controller skeleton and running first tests

We can now implement most of the code of the controller up to the point where the actual business logic kicks in. In main.go, we create a shared informer and a controller object. Within the controller, we add event handlers to this informer that put the events onto a work queue. Finally, we create worker threads that pop the events off the queue and trigger the actual business logic (which we still have to implement). If you have followed my previous posts, this code is straightforward and does not contain anything new. Its structure at this point in time is summarized in the following diagram.

BitcoinControllerStructureI

We are now in a position to actually run our controller and test that the event handlers are called. For that purpose, clone my repository into your workspace, make sure that the CRD has been set up correctly in your cluster and start the controller locally using

$ go run $GOPATH/src/github.com/christianb93/bitcoin-controller/cmd/controller/main.go --kubeconfig "$HOME/.kube/config"

You should now see a few messages telling you that the controller is running and has entered its main loop. Then, in a second terminal, create a test bitcoin network using

$ kubectl apply -f https://raw.githubusercontent.com/christianb93/bitcoin-controller/master/deployments/testNetwork.yaml

You should now see that the ADD handler has been called and see a message that the worker thread has popped the resulting event off the work queue. So our message distribution scheme works! You will also see that even though there are no further changes, update events are published every 30 seconds. The reason for this behaviour is that the cache is resynced every 30 seconds which will push the update events. This can be useful to make sure that a reconciliation is done every 30 seconds, which might heal a potentially incorrect state which was the result of an earlier error.

This is nice, but there is a problem which becomes apparent if you now try to package our code in a container and run it inside the cluster as we have done it at the end of our previous post. This will not produce the same output, but error messages ending with “cannot list resource “bitcoinnetworks” in API group “bitcoincontroller.christianb93.github.com” at the cluster scope”.

The reason for this is that the pod is running with the default service account, and this account does not have the privileges to read our resources. In the next post, we will see how role based access control comes to the rescue.

As before, I have created the tag v0.2 to reflect the status of the code at the end of this post.

Building a bitcoin controller for Kubernetes part I – the basics

As announced in a previous post, we will, in this and the following posts, implement a bitcoin controller for Kubernetes. This controller will be aimed at starting and operating a bitcoin test network and is not designed for production use.

Here are some key points of the design:

  • A bitcoin network will be specified by using a custom resource
  • This definition will contain the number of bitcoin nodes that the controller will bring up. The controller will also talk to the individual bitcoin daemons using the Bitcon JSON RPC API to make the nodes known to each other
  • The controller will monitor the state of the network and maintain a node list which is part of the status subresource of the CRD
  • The bitcoin nodes are treated as stateful pods (i.e. controlled by a stateful set), but we will use ephemeral storage for the sake of simplicity
  • The individual nodes are not exposed to the outside world, and users running tests against the cluster either have to use tunnels or log into the pod to run tests there – this is of course something that could be changed in a future version

The primary goal of writing this operator was not to actually run it in real uses cases, but to demonstrate how Kubernetes controllers work under the hood… Along the way, we will learn a bit about building a bitcoin RPC client in Go, setting up and using service accounts with Kubernetes, managing secrets, using and publishing events and a few other things from the Kubernetes / Go universe.

Step 1: build the bitcoin Docker image

Our controller will need a Docker image that contains the actual bitcoin daemon. At least initially, we will use the image from one of my previous posts that I have published on the Docker Hub. If you decide to use this image, you can skip this section. If, however, you have your own Docker Hub account and want to build the image yourself, here is what you need to do.

Of course, you will first need to log into Docker Hub and create a new public repository.
You will also need to make sure that you have a local version of Docker up and running. Then follow the instructions below, replacing christianb93 in all but the first lines with your Docker Hub username. This will

  • Clone my repository containing the Dockerfile
  • Trigger the build and store the resulting image locally, using the tag username/bitcoind:latest – be patient, the build can take some time
  • Log in to the Docker hub which will store your credentials locally for later use by the docker command
  • Push the tagged image to the Docker Hub
  • Delete your credentials again
$ git clone https://github.com/christianb93/bitcoin.git
$ cd bitcoin/docker 
$ docker build --rm -f Dockerfile -t christianb93/bitcoind:latest .
$ docker login
$ docker push christianb93/bitcoind:latest
$ docker logout

Step 2: setting up the skeleton – logging and authentication

We are now ready to create a skeleton for our controller that is able to start up inside a Kubernetes cluster and (for debugging purposes) locally. First, let us discuss how we package our code in a container and run it for testing purposes in our cluster.

The first thing that we need to define is our directory layout. Following standard conventions, we will place our code in the local workspace, i.e. the $GOPATH directory, under $GOPATH/src/github.com/christianb93/bitcoin-controller. This directory will contain the following subdirectories.

  • internal will contain our packages as they are not meant to be used outside of our project
  • cmd/controller will contain the main routine for the controller
  • build will contain the scripts and Dockerfiles to build everything
  • deployments will holds all manifest files needed for the deployment

By default, Go images are statically linked against all Go specific libraries. This implies that you can run a Go image in a very minimal container that contains only C runtime libraries. But we can go even further and ask the Go compiler to also statically link the C runtime library into the Go executable. This executable is then independent of any other libraries and can therefore run in a “scratch” container, i.e. an empty container. To compile our controller accordingly, we can use the commands

CGO_ENABLED=0 go build
docker build --rm -f ../../build/controller/Dockerfile -t christianb93/bitcoin-controller:latest .

in the directory cmd/controller. This will build the controller and a docker image based on the empty scratch image. The Dockerfile is actually very simple:

FROM scratch

#
# Copy the controller binary from the context into our
# container image
#
COPY controller /
#
# Start controller
#
ENTRYPOINT ["/controller"]

Let us now see how we can run our controller inside a test cluster. I use minikube to run tests locally. The easiest way to run own images in minikube is to build them against the docker instance running within minikube. To do this, execute the command

eval $(minikube docker-env)

This will set some environment variables so that any future docker commands are directed to the docker engine built into minikube. If we now build the image as above, this will create a docker image in the local repository. We can run our image from there using

kubectl run bitcoin-controller --image=christianb93/bitcoin-controller --image-pull-policy=Never --restart=Never

Note the image pull policy – without this option, Kubernetes would try to pull the image from the Docker hub. If you do not use minikube, you will have to extend the build process by pushing the image to a public repository like Docker hub or a local repository reachable from within the Kubernetes cluster that you use for your tests and omit the image pull policy flag in the command above. We can now inspect the log files that our controller writes using

kubectl logs bitcoin-controller

To implement logging, we use the klog package. This will write our log message to the standard output of the container, where they are picked up by the Docker daemon and forwarded to the Kubernetes logging system.

Our controller will need access to the Kubernetes API, regardless of whether we execute it locally or within a Kubernetes cluster. For that purpose, we use a command-line argument kubeconfig. If this argument is set, it refers to a kubectl config file that is used by the controller. We then follow the usual procedure to create a clientset.

In case we are running inside a cluster, we need to use a different mechanism to obtain a configuration. This mechanism is based on a service accounts.

Essentially, service accounts are “users” that are associated with a pod. When we associate a service account with a pod, Kubernetes will map the credentials that authenticate this service account into /var/run/secrets/kubernetes.io/serviceaccount. When we use the helper function clientcmd.BuildConfigFromFlags and pass an empty string as configuration file, the Go client will fall back to in-cluster configuration and try to retrieve the credentials from that location. If we do not specify a service account for the pod, a default account is used. This is what we will do for the time being, but we will soon run into trouble with this approach and will have to define a service account, an RBAC role and a role binding to grant permissions to our controller.

Step 3: create a CRD

Next, let us create a custom resource definition that describes our bitcoin network. This definition is very simple – the only property of our network that we want to make configurable at this point in time is the number of bitcoin nodes that we want to run. We do specify a status subresource which we will later use to track the status of the network, for instance the IP addresses of its nodes. Here is our CRD.

apiVersion: apiextensions.k8s.io/v1beta1
kind: CustomResourceDefinition
metadata:
    name: bitcoin-networks.bitcoin-controller.christianb93.github.com
spec:
    version: v1
    group: bitcoin-controller.christianb93.github.com
    scope: Namespaced
    subresources:
      status: {}
    names:
      plural: bitcoin-networks
      singular: bitcoin-network
      kind: BitcoinNetwork
    validation:
      openAPIV3Schema:
        properties:
          spec:
            required:
            - nodes
            properties:
              nodes:
                type: int

Step 4: pushing to a public repository and running the controller

Let us now go through the complete deployment cycle once, including the push to a public repository. I assume that you have a user on Docker Hub, (for me, this is christianb93), and have set up a repository called bitcoin-controller in this account. I will also assume that you have done a docker login before running the commands below. Then, building the controller is easy – simply run the following commands, replacing the christianb93 in the last two commands with your username on Docker Hub.

cd $GOPATH/src/github.com/christianb93/bitcoin-controller/cmd/controller
CGO_ENABLED=0 go build
docker build --rm -f ../../build/controller/Dockerfile -t christianb93/bitcoin-controller:latest .
docker push christianb93/bitcoin-controller:latest

Once the push is complete, you can run the controller using a standard manifest file as the one below.

apiVersion: v1
kind: Pod
metadata:
  name: bitcoin-controller
  namespace: default
spec:
  containers:
  - name: bitcoin-controller-ctr
    image: christianb93/bitcoin-controller:latest

Note that this will only pull the image from Docker Hub if we delete the local image using

docker rmi christianb93/bitcoin-controller:latest

from the minikube Docker repository (or did not use that repository at all). You will see that pushing takes some time, this is why I prefer to work with the local registry most of the time and only push to the Docker Hub once in a while.

We now have our build system in place and a working skeleton which we can run in our cluster. This version of the code is available in my GitHub repository under the v0.1 tag. In the next post, we will start to add some meat – we will model our CRD in a Go structure and put our controller in a position to react on newly added bitcoin networks.