Playing with Travis CI

You are using Github to manage your open source projects and want a CI/CD pipeline, but do not have access to a permanently available private infrastructure? Then you might want to take a look at hosted CI/CD platforms like Bitbucket pipelines, Gitlab, CircleCI – or Travis CI

When I was looking for a cloud-based integration platform for my own projects, I decided to give Travis CI a try. Travis offers builds in virtual machines, which makes it much easier to spin up local Kubernetes clusters with e.g. kind for integration testing, offers unlimited free builds for open source projects, is fully integrated with Github and makes setting up standard builds very easy – of course more sophisticated builds require more work. In this post, I will briefly describe the general usage of Travis CI, while a later post will be devoted to the design and implementation of a sample pipeline integrating Kubernetes, Travis and Helm.

Introduction to Travis CI

Getting started with Travis is easy, assuming that you already have a Github account. Simply navigate to the Travis CI homepage, sign up with your Github account and grant the required authorizations to Travis. You can then activate Travis for your Github repositories individually. Once Travis has been enabled for a repository, Travis will create a webhook so that every commit in the repository triggers a build.

For each build, Travis will spin up a virtual machine. The configuration of this machine and the subsequent build steps are defined in a file in YAML format called .travis.yml that needs to be present in the root directory of the repository.

Let us look at a very simple example to see how this works. As a playground, I have created a simple sample repository that contains a “Hello World” implementation in Go and a corresponding unit test. In the root directory of the repository, I have placed a file .travis.yml with the following content.

language: go
dist: xenial

go:
  - 1.10.8

script:
  - go build
  - go test -v -count=1

This is file in YAML syntax, defining an associative array, i.e. key/value pairs. Here, we see four keys: language, dist, go and script. While the first three keys define settings (the language to use, the base image for the virtual machine that Travis will create and the Go version), the fourth key is a build phase and defines a list of commands which will be executed during the build phase. Each of these commands can be an ordinary command as you would place it in a shell script, in particular you can invoke any program or shell script you need.

To see this in action, we can now trigger a test build in Travis. There are several options to achieve this, I usually place a meaningless text file somewhere in the repository, change this file, commit and push to trigger a build. When you do this and wait for a few minutes, you will see a new build in your Travis dashboard. Clicking on this build takes you to the build log, which is displayed on a screen similar to the following screenshot.

TravisBuild

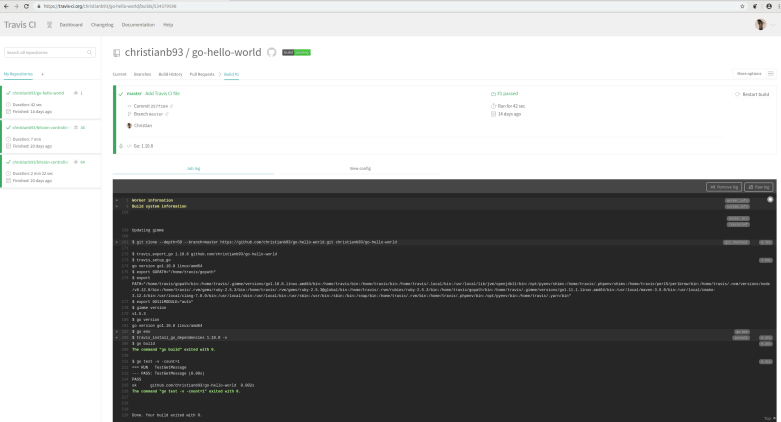
Working your way through this logfile, it becomes pretty transparent what Travis is doing. First, it will create a virtual machine for the build, using Ubuntu Xenial (16.04) as a base system (which I did select using the dist key in the Travis CI file). If you browse the system information, you will see some indications that behind the scenes, Travis is using Googles Cloud Platform GCP to provision the machine. Then, a Go language environment is set up, using Go 1.10.8 (again due to the corresponding setting in the Travis CI file), and the repository that triggered the build is cloned.

Once these steps have been completed, the Travis engine processes the job in several phases according to the Travis lifecycle model. Not all phases need to be present in the Travis CI file, if a phase is not specified, default actions are taken. In our case, the install phase is not defined in the file, so Travis executes a default script which depends on the programming language and in our case simply invokes go get.

The same holds for the build phase. Here, we have overwritten the default action for the build phase using the script tag in the Travis CI file. This tag is a YAML formatted list of commands which will be executed step by step during the build phase. Each of these commands can indicate failure by returning a non-zero exit code, but still, all commands will be executed even if one of the previous commands has failed – this is important to understand when designing your build phase. Alternatively, you could of course place your commands in a shell script and use for instance set -e to make sure that the script fails if one individual step fails.

A more complex job will usually have additional phases after the build phase, like a deploy phase. The commands in the deploy phase are only executed once your build phase completes successfully and are typically used to deploy a “green” build into the next stage.

Environment variables and secrets

During your build, you will typically need some additional information on the build context. Travis offers a couple of mechanisms to get access to that information.

First, there are of course environment variables that Travis will set for you. It is instructive to study the source code of the Travis build system to see where these variables are defined – like builtin.rb or several bash scripts like travis_export_go or travis_setup_env. Here is a list of the most important environment variables that are available.

  • TRAVIS_TMPDIR is pointing to a temporary directory that your scripts can use
  • TRAVIS_HOME is set to the home directory of the travis user which is used for running the build
  • TRAVIS_TAG is set only if the current build is for a git tag, if this is the case, it will contain the tag name
  • TRAVIS_COMMIT is the full git commit hash of the current build
  • TRAVIS_BUILD_DIR is the absolute path name to the directory where the Git checkout has been done to and where the build is executed

In addition to these built-in variables, users have several options to declare environment variables on top. First, environment variables can be declared using the env tag in the Travis CI file. Note that Travis will trigger a build for each individual item in this list, with the environment variables set to the values specified in this line. Thus if you want to avoid additional builds, specify all environment variables in one line like this.

env:
  - FOO=foo BAR=bar

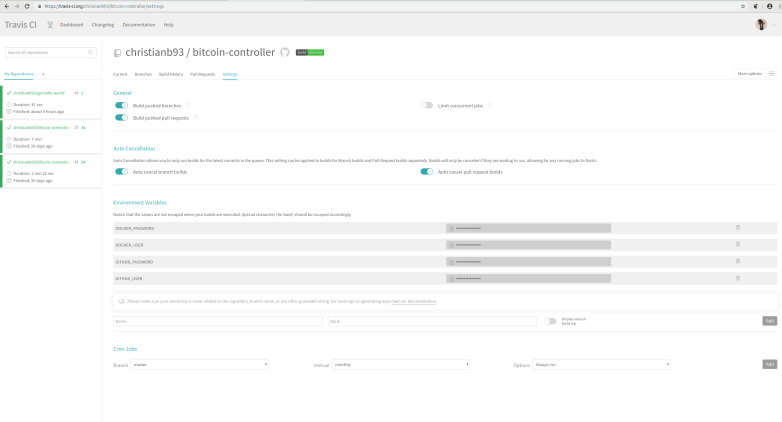
Now suppose that during your build, you want to push a Docker image into your public repository, or you want to publish an artifact on your GitHub page. You will then need access to the respective credentials. Storing these credentials as environment variables in the Travis CI file is a bad idea, as anybody with read access to your Github repository (i.e. the world) can read your credentials. To handle this use case, Travis offers a different option. You can specify environment variables on the repository level in the Travis CI web interface, which are then available to every build for this repository. These variables are stored in encrypted form and – assuming that you trust Travis – appear to be reasonably safe (when you use Travis, you have to grant them privileged access to your GitHub repository anyway, so if you do not trust them, you might want to think about a privately hosted CI solution).

TravisRepositorySettings

Testing a build configuration locally

One of the nice things with Travis is that the source code of the build system is publicly available on GitHub, along with instructions on how to use it. This is very useful if you are composing a Travis CI file and run into errors which you might want to debug locally.

As recommended in the README of the repository, it is a good idea to do this in a container. I have turned the build instructions on this page into a Dockerfile that is available as a gist. Let us use this and the Travis CI file from my example repository to dive a little bit into the inner workings of Travis.

For that purpose, let us first create an empty directory, download the Docker file and build it.

$ mkdir ~/travis-test
$ cd ~/travis-test
$ wget https://gist.githubusercontent.com/christianb93/e14252a122d081a219b84a905a40543f/raw/1525fec3b26c7dc4eab71e7838c02f8637e40675/Dockerfile.travis-build
$ docker build --tag travis-build --file Dockerfile.travis-build .

Next, clone my test repository and run the container, mounting the current directory as a bind mount on /travis-test

$ git clone --depth=1 https://github.com/christianb93/go-hello-world
$ docker run -it -v $(pwd):/travis-test travis-build

You should now see a shell prompt within the container, with a working directory containing a clone of the travis build repository. Let us grab our Travis CI file and copy it to the working directory.

# cp /travis-test/go-hello-world/.travis.yml .

When Travis starts a build, it internally converts the Travis CI file into a shell script. Let us do this for our sample file and take quick look a the resulting shell script. Within the container, run

# bin/travis compile > /travis-test/script

The compile command will create the shell script and print it to standard output. Here, we redirect this back into the bind mount to have it on the host where you can inspect it using your favorite code editor. If you open this script, you will see that it is in fact a bash script that first defines some of the environment variables that we have discussed earlier. It then defines and executes a function called travis_preamble and then prints a very long string containing some function definitions into a file called job_stages which is then sourced, so that these functions are available. A similar process is then repeated several times, until finally, at the end of the script, a collection of these functions is executed.

Actually running this script inside the container will fail (the script expects some environment that is not present in our container, it will for instance probe a specific URL to connect to the Travis build system), but at least the script job_stages will be created and can be inspected. Towards the end of the script, there is one function for each of the phases of a Travis build job, and starting with these functions, we could now theoretically dive into the script and debug our work.

Caching with Travis CI

Travis runs each job in a new, dedicated virtual machine. This is very useful, at it gives you a completely reproducable and clean build environment, but also implies that it is difficult to cache results during builds. Go, for instance, maintains a build cache that significantly reduces build times and that is not present by default during a build on Travis. Dependencies are also not cached, meaning that they have to be downloaded over and over again with each new build.

To enable caching, a Travis CI file can contain a cache directive. In addition to a few language specific options, this allows you to specify a list of directories which are cached between builds. Behind the scenes, Travis uses a caching utility which will store the content of the specified directories in a cloud object store (judging from the code, this is either AWS S3 or Google’s GCS). At the end of a build, the cached directories are scanned and if the content has changed, a new archive is created and uploaded to the cloud storage. Conversely, when a job is started, the archive is downloaded and unzipped to create the cached directories. Thus we learn that

  • The cached content still needs to be fetched via the network, so that caching for instance a Docker image is not necessarily faster than pulling the image from the Docker Hub
  • Whenever something in the cached directories changes, the entire cache is rebuilt and uploaded to the cloud storage

These characteristics imply that caching just to avoid network traffic will usually not work – you should cache data to avoid repeated processing of the same data. In my experience, for instance, caching the Go build cache is really useful to speed up builds, but caching Docker images (by exporting them into an archive which is then placed in a cached directory) can actually be slower than downloading the images again for each build.

Using the API to inspect your build results

So far, we have operated Travis through the web interface. However, to support full automation, Travis does of course also offer an API.

To use the API, you will first have to navigate to your profile and retrieve an API token. For the remainder of this section, I will assume that you have done this and defined an environment variable travisToken that contains this token. The token needs to be present in the authorization header of each HTTPS request that goes to the API.

To test the API and the token, let us first get some data on our user using curl. So in a terminal window (in which you have exported the token) enter

$ curl -s\
  -H "Travis-API-Version: 3"\
  -H "Authorization: token $travisToken" \
  https://api.travis-ci.org/user | jq

As a result, you should see a JSON formatted output that I do not reproduce here for privacy reasons. Among other fields, you should be able to see your user ID, both as a string and an integer, as well as your Github user ID, demonstrating that the token works and is associated with your credentials.

As a different and more realistic example, let us suppose that you wanted to retrieve the state of the latest build for the sample repository go-hello-world. You would then navigate from the repository, identified by its slug (i.e. the combination of Github user name and repository), to its builds, sort the builds by start date and use jq to retrieve the status of the first entry in the list.

$ curl -s\
    -H "Travis-API-Version: 3"\
    -H "Authorization: token $travisToken" \
    "https://api.travis-ci.org/repo/christianb93%2Fgo-hello-world/builds?limit=5&sort_by=started_at:desc" \
     | jq -r '.builds[0].state'

Note that we need to properly format the backslash which is part of the URL and need to include the entire URL in double quotes so that the shell does not interpret the ampersand & as an instruction to spawn curl in the background.

There is of course much more that you can do with the API – you can activate and deactivate repositories, trigger and cancel builds, retrieve environment variables, change repository settings and so forth. Instead of using the API directly with curl, you could also use the official Travis client which is written in Ruby, and it would probably not be very difficult to create a simple library accessing that API in any other programming language.

We have reached the end of this short introduction to Travis CI. In one of the next posts, I will show you how to actually put this into action. We will build a CI pipeline for my bitcoin controller which fully automates unit and integration tests using Helm and kind to spin up a local Kubernetes cluster. I hope you enjoyed this post and come back to read more soon.

Building a bitcoin controller for Kubernetes part VIII – creating a helm chart

Our bitcoin controller is more or less complete, and can be deployed into a Kubernetes cluster. However, the deployment process itself is still a bit touchy – we need to deploy secrets, RBAC profiles and the CRD, bring up a pod running the controller and make sure that we grab the right version of the involved images. In addition, doing this manually using kubectl makes it difficult to reconstruct which version is running, and environment specific configurations need to be made manually. Enter Helm….

Helm – an overview

Helm is (at the time of writing, this is supposed to change with the next major release) a combination of two different components. First, there is the helm binary itself which is a command-line interface that typically runs locally on your workstation. Second, there is Tiller which is a controller running in your Kubernetes cluster and carrying out the actual deployment.

With Helm, packages are described by charts. A chart is essentially a directory with a certain layout and a defined set of files. Specifically, a Helm chart directory contains

  • A file called Chart.yaml that contains some basic information on the package, like its name, its version, information on its maintainers and a timestamp
  • A directory called templates. The files in this directory are Kubernetes manifests that need to be applied as part of the deployment, but there is a twist – these files are actually templates, so that parts of these files can be placeholders that are filled as part of the deployment process.
  • A file called values.yaml that contains the values to be used for the placeholders

To make this a bit more tangible, suppose that you have an application which consists of several pods. One of these pods runs a Docker image, say myproject/customer-service. Each time you build this project, you will most likely create a new Docker image and push it into some repository, and you will probaby use a unique tag name to distinguish different builds from each other.

When you deploy this without Helm, you would have to put the tag number into the YAML manifest file that describes the deployment. With every new build, you would then have to update the manifest file as well. In addition, if this tag shows up in more than one place, you would have to do this several times.

With Helm, you would not put the actual tag into the deployment manifest, but use a placeholder. These placeholders follow the Go template syntax. Instead, you would put the actual tag into the values.yaml file. Thus the respective lines in your deployment would be something like

containers:
  - name: customer-service-ctr
    image: myproject/customer-service:{{.Values.customer_service_image_tag}}

and within the file values.yaml, you would provide a value for the tag

customer_service_image_tag: 0.7

When you want to install the package, you would run helm install . in the directory in which your package is located. This would trigger the process of joining the templates and the values to create actual Kubernetes manifest files and apply these files to your cluster.

Of course there is much more that you can customize in this way. As an example, let us take a look at the Apache helm chart published by Bitnami. When you read the deployment manifest in the templates folder, you will find that almost every value is parametrized. Some of these parameters – those starting with .Values – are defined in the values.yaml. Others, like those starting with .Release, refer to the current release and are auto-generated by Helm. Here, a release in the Helm terminology is simply the result of installing a chart. This does, for instance, allow you to label pods with a label that contains the release in which they were created.

Helm repositories

So far, we have described Helm charts as directories. This is one way to implement Helm charts – those of you who have worked with J2EE and WAR files before might be tempted to call this the “exploded” view. However, you can also bundle all files that comprise a chart into a single archive. These archives can be published in a Helm repository.

Technically, a Helm repository is nothing but an URL that can serve two types of objects. First, there is a collection of archives (zipped tar files with suffix .tgz). These files contain the actual Helm charts – they are literally archived versions of an exploded directory, created using the command helm package. Second, there is an index, a file called index.yaml that lists all archives contained in the repository and contains some metadata. An index file can be created using the command helm repo index.

Helm maintains a list of known repositories, similar to a package manager like APT that maintains a list of known package sources. To add a new repository to this list, use the helm repo add command.

Let us again take a look at an example. Gitlab maintains a Helm repository at the URL https://charts.gitlab.io. If you add index.yaml to this URL and submit a GET request, you will get this file. This index file contains several entries for different charts. Each chart has, among other fields, a name, a version and the URL of an archive file containing the actual chart. This archive can be on the same web server, or somewhere else. If you use Helm to install one of the charts from the repository, Helm will use the latest version that shows up in the index file, unless you specify a version explicitly.

Installing and running Helm

Let us go through an example to see how all this works. We assume that you have a running Kubernetes cluster and a kubectl pointing to this cluster.

First, let us install Helm. As explained earlier, this involves a local installation and the installation of Tiller in your cluster. The local installation depends, of course, on your operating system. Several options are available and described here.

Once the helm binary is in your path, let us install the Tiller daemon in your cluster. Before we do this, however, we need to think about service accounts. Tiller, being the component of Helm that is responsible for carrying out the actual deployment, requires the permissions to create, update and delete basically every Kubernetes resource. To make this possible, we need to define a service account that Tiller uses and map this account to a corresponding cluster role. For a test setup, we can simply use the pre-existing cluster-admin role.

$ kubectl create serviceaccount tiller -n kube-system
$ kubectl create clusterrolebinding tiller --clusterrole=cluster-admin  --serviceaccount=kube-system:tiller

Once this has been done, we can now instruct Helm to set up its local configuration and to install Tiller in the cluster using this service account.

$ helm init --service-account tiller

If you now display all pods in your cluster, you will see that a new Tiller pod has been created in the namespace kube-system (this is why we created our service account in that namespace as well).

Now we can verify that this worked. You could, for instance, run helm list which will list all releases in your cluster. This should not give you any output, as we have not yet installed anything. Let us change this – as an example, we will install the Bitnami repo referenced earlier. As a starting point, we retrieve the list of repos that Helm is currently aware of.

$ helm repo list
NAME    URL
stable  https://kubernetes-charts.storage.googleapis.com
local   http://127.0.0.1:8879/charts

These are the default repositories that Helm knows from scratch. Let us now add the Bitnami repo and then use the search function to find all Gitlab charts.

$ helm repo add bitnami https://charts.bitnami.com
$ helm search bitnami

This should give you a long list of charts that are now available for being installed, among them the chart for the Apache HTTP server. Let us install this.

$ helm install bitnami/apache

Note how we refer to the chart – we use the combination of the chart name that we have used when doing our helm repo add and the name of the chart. You should now see a summary that lists the components that have been installed as part of this release – a pod, a load balancer service and a deployment. You can also track the status of the service using kubectl get svc. After a few seconds, the load balancer should have been brough up, and you should be able to curl it.

You will also see that Helm cas created a release name for you that you can reference the release. You can now use this release name and the corresponding helm commands to delete or upgrade your release.

A helm repository for our bitcoin controller

It is easy to set up a Helm repository for the bitcoin controller. As mentioned earlier, every HTTP server will do. I use Github for this purpose. The Helm repository itself is here. It contains the archives that have been created with helm package and the index file which is the result of helm index. With that repository in place, it is very easy to install our controller – two lines will do.

$ helm repo add bitcoin-controller-repo https://raw.githubusercontent.com/christianb93/bitcoin-controller-helm/master
$ helm install bitcoin-controller-repo/bitcoin-controller

An exploded view of this archive is available in a separate Github repository. This version of the Helm chart is automatically updated as part of my CI/CD pipeline (which I will describe in more detail in a later post), and when all tests succeed, this repository is packaged and copied into the Helm repository.

This completes our short introduction to Helm and, at the same time, is my last post in the short series on Kubernetes controllers. I highly recommend to spend some time with the quite readable documentation at helm.sh to learn more about Helm templates, repositories and the life cycle of releases. If you want to learn more about controllers, my best advice is to read the source code of the controllers that are part of Kubernetes itself that demonstrate all of the mechanisms discussed so far and much more. Happy hacking!

Building a bitcoin controller for Kubernetes part VII – testing

Kubernetes controllers are tightly integrated with the Kubernetes API – they are invoked if the state of the cluster changes, and they act by invoking the API in turn. This tight dependency turns testing into a challenge, and we need a smart testing strategy to be able to run unit and integration tests efficiently.

The Go testing framework

As a starting point, let us recall some facts about the standard Go testing framework and see what this means for the organization of our code.

A Go standard installation comes with the package testing which provides some basic functions to define and execute unit tests. When using this framework, a unit test is a function with a signature

func TestXXX(t *testing.T)

where XXX is the name of your testcase (which, ideally, should of course reflect the purpose of the test). Once defined, you can easily run all your tests with the command

$ go test ./...

from the top-level directory of your project. This command will scan all packages for functions following this naming convention and invoke each of the test functions. Within each function, you can use the testing.T object that can be used to indicate failure and log error messages. At the end of a test execution, a short summary of passed and failed tests will be printed.

It is also possible to use go test to create and display a coverage analysis. To do this, run

$ go test ./... -coverprofile /tmp/cp.out
$ go tool cover -html=/tmp/cp.out

The first command will execute the tests and write coverage information into /tmp/cp.out. The second command will turn the contents of this file into HTML output and display this nicely in a browser, resulting in a layout as below (and yes, I understand that test coverage is a flawed metric, but still it is useful….)

GoTestCoverage

How do we utilize this framework in our controller framework? First, we have to decide in which packages we place the test functions. The Go documentation recommends to place the test code in the same package as the code under test, but I am not a big fan of this approach, because this will allow you to access private methods and attributes of the objects under test and not to test against contracts, but against implementation. Therefore I have decided to put the code for unit testing a package XYZ into a dedicated package XYZ_test (more on integration tests below).

This approach has its advantages, but requires that you take testability into account when designing your code (which, of course, is a good idea anyway). In particular, it is good practice to use interfaces to allow for injection of test code. Let us take the code for the bitcoin RPC client as an example. Here, we use an interface HTTPClient to model the dependency of the RPC client from a HTTP clent. This interface is implemented by the client from the HTTP package, but for testing purposes, we can use a mock implementation and inject it when creating a bitcoin RPC client.

We also have to think about separation of unit tests which will typically use mock objects from integration tests that require a running Kubernetes cluster or a bitcoin daemon. There are different ways to do this, but the approach that I have chosen is as follows.

  • Unit tests are placed in the same directory as the code that they test
  • A unit test functions has a name that ends with “Unit”
  • Integration tests – which typically test the system as a whole and thus are not clearly linked to an individual package – are placed in a global subdirectory test
  • Integration test function names end on “Integration”

With this approach, we can run all unit tests by executing

go test ./... -run "Unit"

from the top-level directory, and can use the command

go test -run "Integration"

from within the test directory to run all integration tests.

The Kubernetes testing package

To run useful unit tests in our context, we typically need to simulate access to a Kubernetes API. We could of course our own mock objects, but fortunately, the Kubernetes client go package comes with a set of ready-to-use helper objects to do this. The core of this is the package client-go/testing. The key objects and concepts used in this package are

  • An action describes an API call, i.e. a HTTP request against the Kubernetes API, by defining the namespace, the HTTP verb and the resource and subresource that is addressed
  • A Reactor describes how a mock object should react to a particular action. We can ask a Reactor whether it is ready to handle a specific action and then invoke its React action to actually do this
  • A Fake object is essentially a collection of actions recording the actions that have been taken on the mock object and reactors that react upon these actions. The core of the Fake object is its Invoke method. This method will first record the action and then walk the registered reactors, invoking the first reactor that indicates that it will handle this action and returning its result

This is of course rather a framework than a functional mock object, but the client-go library offers more – it has a generated set of fake client objects that build on this logic. In fact, there is a fake clientset in the package client-go/kubernetes/fake which implements the kubernetes.Interface interface that makes up a Kubernetes API client. If you take a look at the source code, you will find that the implementation is rather straightforward – a fake clientset embeds a testing.Fake object and a testing.ObjectTracker which is essentially a simple object store. To link those two elements, it installs reactors for the various HTTP verbs like GET, UPDATE, … that simply carry out the respective action on the object tracker. When you ask such a fake clientset for, say, a Nodes object, you will receive an object that delegates the various methods like Get to the invoke method of the underlying fake object which in turn uses the reactors to get the result from the object tracker. And, of course, you can add your own reactors to simulate more specific responses.

KubernetesTesting

Using the Kubernetes testing package to test our bitcoin controller

Let us now discuss how we can use that testing infrastructure provided by the Kubernetes packages to test our bitcoin controller. To operate our controller, we will need the following objects.

  • Two clientsets – one for the standard Kubernetes API and one for our custom API – here we can utilize the machinery described above. Note that the Kubernetes code generators that we use also creates a fake clientset for our bitcoin API
  • Informer factories – again there will be two factories, one for the Kubernetes API and one for our custom API. In a fully integrated environment these informers would invoke the event handlers of the controller and maintain the cache. In our setup, we do not actually run the controller, but only use the cache that they contain, and maintain the cache ourselves. This gives us more control about the contents of the cache, the timing and the invocations of the event handlers.
  • A fake bitcoin client that we inject into the controller to simulate the bitcoin RPC server

Its turns out to be useful to collect all components that make up this test bed in a Go structure testFixture. We can then implement some recurring functionality like the basic setup or starting and stopping the controller as methods of this object.

TestFixture

In this approach, there is a couple of pitfalls. First, it is important to keep the informer caches and the state stored in the fake client objects in sync. If, for example, we let the controller add a new stateful set, it will do this via the API, i.e. in the fake clientset, and we need to push this stateful set into the cache so that during the next iteration, the controller can find it there.

Another challenge is that our controller uses go routines to do the actual work. Thus, whenever we invoke an event handler, we have to wait until the worker thread has picked up the resulting queued event before we can validate the results. We could do this by simply waiting for some time, however, this is of course not really reliable and can lead to long execution times. Instead, it is a better approach to add a method to the controller which allows us to wait until the controller internal queue is empty and makes the tests deterministic. Finally, it is good practice to put independent tests into independent functions, so that each unit test function starts from scratch and does not rely on the state left over by the previous function. This is especially important because go test will cache test results and therefore not necessarily execute all test cases every time we run the tests.

Integration testing

Integration testing does of course require a running Kubernetes cluster, ideally a cluster that can be brought up quickly and can be put into a defined state before each test run. There are several options to achieve this. Of course, you could make use of your preferred cloud provider to bring up a cluster automatically (see e.g. this post for instructions on how to do this in Python), run your tests, evaluate the results and delete the cluster again.

If you prefer a local execution, there are by now several good candidates for doing this. I have initially executed integration tests using minikube, but found that even though this does of course provide perfect isolation, it has the disadvantage that starting a new minikube cluster takes some time, which can slow down the integration tests considerably. I have therefore switched to kind which runs Kubernetes locally in a Docker container. With kind, a cluster can be started in approximately 30 seconds (depending, of course, on your machine). In addition, kind offers an easy way to pre-load docker images into the nodes, so that no download from Docker hub is needed (which can be very slow). With kind, the choreography of a integration test run is roughly as follows.

  • Bring up a local bitcoin daemon in Docker which will be used to test the Bitcoin RPC client which is part of the bitcoin controller
  • Bring up a local Kubernetes cluster using kind
  • Install the bitcoin network CRD, the RBAC profile and the default secret
  • Build the bitcoin controller and a new Docker image and tag it in the local Docker repository
  • Pre-load the image into the nodes
  • Start a pod running the controller
  • Pre-pull the docker image for the bitcoin daemon
  • Run the integration tests using go test
  • Tear down the cluster and the bitcoin daemon again

I have created a shell script that runs these steps automatically. Currently, going through all these steps takes about two minutes (where roughly 90 seconds are needed for the actual tests and 30 seconds for setup and tear-down). For the future, I plan to add support for microk8s as well. Of course, this could be automated further using a CI/CD pipeline like Jenkins or Travis CI, with proper error handling, a clean re-build from a freshly cloned repo and more reporting functionality – this is a topic that I plan to pick up in a later post.