
In the last post, we have seen how Octavia works at an architectural level and have gone through the process of installing and configuring Octavia. Today, we will see Octavia in action – we will create our first load balancer and inspect the resulting configuration to better understand what Octavia is doing.
Creating a load balancer
This post assumes that you have followed the instructions in my previous post and run Lab14, so that you are now proud owner of a working OpenStack installation including Octavia. If you have not done this yet, here are the instructions to do so.
git clone https://www.github.com/christianb93/openstack-labs
cd openstack-labs/Lab14
wget https://s3.eu-central-1.amazonaws.com/cloud.leftasexercise.com/amphora-x64-haproxy.qcow2
vagrant up
ansible-playbook -i hosts.ini site.yaml
Now, let us bring up a test environment. As part of the Lab, I have provided a playbook which will create two test instances, called web-1 and web-2. To run this playbook, enter
ansible-playbook -i hosts.ini demo.yaml
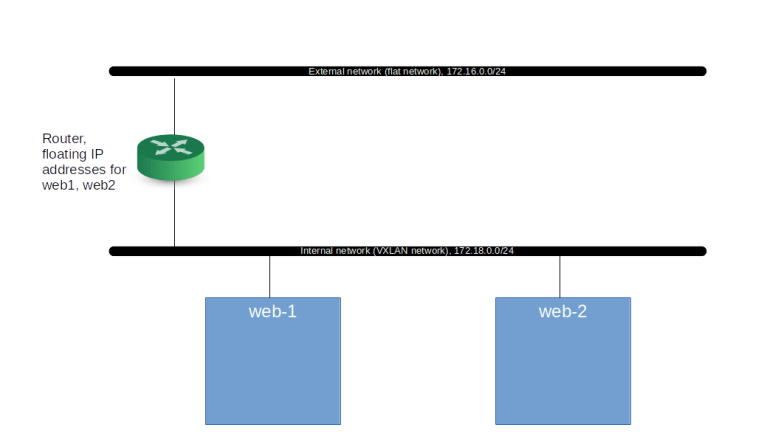
In addition to the test instances, the playbook is creating a demo user and a role called load-balancer_admin. The default policy distributed with Octavia will grant all users to which this role is assigned the right to read and write load balancer configurations, so we assign this role to the demo user as well. The playbook will also set up an internal network to which the instances are attached plus a router, and will assign floating IP addresses to the instances, creating the following setup.
Once the playbook completes, we can log into the network node and inspect the running servers.
vagrant ssh network
source demo-openrc
openstack server list
Now its time to create our first load balancer. The load balancer will listen for incoming traffic on an address which is traditionally called virtual IP address (VIP). This terminology originates from a typical HA setup, in which you would have several load balancer instances in an active-passive configuration and use a protocol like VRRP to switch the IP address over to a new instance if the currently active instance fails. In our case, we do not do this, but still the term VIP is commonly used. When we create a load balancer, Octavia will assign a VIP for us and attach the load balancer to this network, but we need to pass the name of this network to Octavia as a parameter. With this, our command to start the load balancer and to monitor the Octavia log file to see how the provisioning process progresses is as follows.
openstack loadbalancer create \
  --name demo-loadbalancer\
  --vip-subnet external-subnet
sudo tail -f /var/log/octavia/octavia-worker.log
In the log file output, we can nicely see that Octavia is creating and signing a new certificate for use by the amphora. It then brings up the amphora and tries to establish a connection to its port 9443 (on which the agent will be listening) until the connection succeeds. If this happens, the instance is supposed to be ready. So let us wait until we see a line like “Mark ACTIVE in DB…” in the log file, hit ctrl-c and then display the load balancer.
openstack loadbalancer list
openstack loadbalancer amphora list
You should see that your new load balancer is in status ACTIVE and that an amphora has been created. Let us get the IP address of this amphora and SSH into it.
amphora_ip=$(openstack loadbalancer amphora list \
  -c lb_network_ip -f value)
ssh -i amphora-key ubuntu@$amphora_ip
Nice. You should now be inside the amphora instance, which is running a stripped down version of Ubuntu 16.04. Now let us see what is running inside the amphora.
ifconfig -a
sudo ps axwf
sudo netstat -a -n -p -t -u
We find that in addition to the usual basic processes that you would expect in every Ubuntu Linux, there is an instance of the Gunicorn WSGI server, which runs the amphora agent, listening on port 9443. We also see that the amphora agent holds a UDP socket, this is the socket that the agent uses to send health messages to the control plane. We also see that our amphora has received an IP address on the load balancer management network. It is also instructive to display the configuration file that Octavia has generated for the agent – here we find, for instance, the address of the health manager to which the agent should send heartbeats.
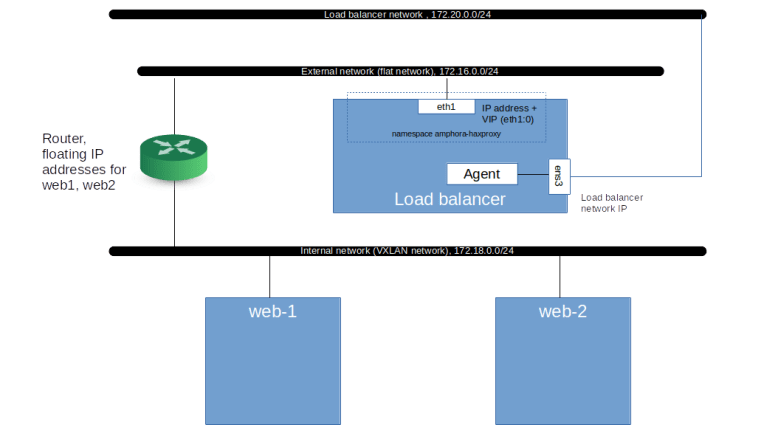
This is nice, but where is the actual proxy? Based on our discussion of the architecture, we would have expected to see a HAProxy somewhere – where is it? The answer is that Octavia puts this HAProxy into a separate namespace, to avoid potential IP address range conflicts between the subnets on which HAProxy needs to listen (i.e. the subnet on which the VIP lives, which is specified by the user) and the subnet to which the agent needs to be attached (the load balancer management network, specified by the administrator). So let us look for this namespace.
ip netns list
In fact, there is a namespace called amphora-haproxy. We can use the ip netns exec command and nsenter to take a look at the configuration inside this namespace.
sudo ip netns exec amphora-haproxy ifconfig -a
We see that there is a virtual device eth1 inside the namespace, with an IP address on the external network. In addition, we see an alias on this device, i.e. essentially a second IP address. This the VIP, which could be detached from this instance and attached to another instance in an HA setup (the first IP is often called the VRRP address, again a term originating from its meaning in a HA setup as being the IP address of the interface across which the VRRP protocol is run).
At this point, no proxy is running yet (we will see later that the proxy is started only when we create listeners), so the configuration that we find is as displayed below.
Monitoring load balancers
We have mentioned several times that the agent is send hearbeats to the health manager, so let us take a few minutes to dig into this. During the installation, we have created a virtual device called lb_port on our network node, which is attached to the integration bridge to establish connectivity to the load balancer management network. So let us log out of the amphora to get back to the network node and dump the UDP traffic crossing this interface.
sudo tcpdump -n -p udp -i lb_port
If we look at the output for a few seconds, then we find that every 10 seconds, a UDP packet arrives, coming from the UDP port of the amphora agent that we have seen earlier and the IP address of the amphora on the load balancer management network, and targeted towards port 5555. If you add -A to the tcpdump command, you find that the output is unreadable – this is because the heartbeat message is encrypted using the heartbeat key that we have defined in the Octavia configuration file. The format of the status message that is actually sent can be found here in the Octavia source code. We find that the agent will transmit the following information as part of the status messages:
- The ID of the amphora
- A list of listeners configured for this load balancer, with status information and statistics for each of them
- Similarly, a list of pools with information on the members that the pool contains
We can display the current status information using the OpenStack CLI as follows.
openstack loadbalancer status show demo-loadbalancer
openstack loadbalancer stats show demo-loadbalancer
At the moment, this is not yet too exciting, as we did not yet set up any listeners, pools and members for our load balancer, i.e. our load balancer is not yet accepting and forwarding any traffic at all. In the next post, we will look in more detail into how this is done.

1 Comment