In the playbooks that we have considered so far, we have used tasks, links to the inventory and modules. In this post, we will add another important feature of Ansible to our toolbox – variables.
Declaring variables
Using variables in Ansible is slightly more complex than you might expect at the first glance, mainly due to the fact that variables can be defined at many different points, and the precedence rules are a bit complicated, making errors likely. Ignoring some of the details, here are the essential options that you have to define variables and assign values:
- You can assign variables in a playbook on the level of a play, which are then valid for all tasks and all hosts within that play
- Similarly, variables can be defined on the level of an individual task in a playbook
- You can define variables on the level of hosts or groups of hosts in the inventory file
- There is a module called set_fact that allows you to define variables and assign values which are then scoped per host and for the remainder of the playbook execution
- Variables can be defined on the command line when executing a playbook
- Variables can be bound to a module so that the return values of that module are assigned to that variable within the scope of the respective host
- Variable definitions can be moved into separate files and be referenced from within the playbook
- Finally, Ansible will provide some variables and facts
Let us go through these various options using the following playbook as an example.
---
- hosts: all
  become: yes
  # We can define a variable on the level of a play, it is
  # then valid for all hosts to which the play applies
  vars:
    myVar1: "Hello"
  vars_files:
  - vars.yaml
  tasks:
    # We can also set a variable using the set_fact module
    # This will be valid for the respective host until completion
    # of the playbook
  - name: Set variable
    set_fact:
      myVar2: "World"
      myVar5: "{{ ansible_facts['machine_id'] }}"
    # We can register variables with tasks, so that the output of the
    # task will be captured in the variable
  - name: Register variables
    command: "date"
    register:
      myVar3
  - name: Print variables
    # We can also set variables on the task level
    vars:
      myVar4: 123
    debug:
      var: myVar1, myVar2, myVar3['stdout'], myVar4, myVar5, myVar6, myVar7
At the top of this playbook, we see an additional attribute vars on the level of the play. This attribute itself is a list and contains key-value pairs that define variables which are valid across all tasks in the playbook. In our example, this is the variable myVar1.
The same syntax is used for the variable myVar4 on the task level. This variable is then only valid for that specific task.
Directly below the declaration of myVar1, we instruct Ansible to pick up variable definitions from an external file. This file is again in YAML syntax and can define arbitrary key-value pairs. In our example, this file could be as simple as
---
  myVar7: abcd
Separating variable definitions from the rest of the playbook is very useful if you deal with several environments. You could then move all environment-specific variables into separate files so that you can use the same playbook for all environments. You could even turn the name of the file holding the variables into a variable that is then set using a command line switch (see below), which allows you to use different sets of variables for each execution without having to change the playbook.
The variable myVar3 is registered with the module command, meaning that it will capture the output of this module. Note that this output will usually be a complex data structure, i.e. a dictionary. One of the keys in this dictionary, which depends on the module, is typically stdout and captures the output of the command.
For myVar2, we use the module set_fact to define it and assign a value to it. Note that this value will only be valid per host, as myVar5 demonstrates (here we use a fact and Jinja2 syntax – we will discuss this further below).
In the last task of the playbook, we print out the value of all variables using the debug module. If you look at this statement, you will see that we print out a variable – myVar6 – which is not defined anywhere in the playbook. This variable is in fact defined in the inventory. Recall that the inventory for our test setup with Vagrant introduced in the last post looked as follows.
[servers]
192.168.33.10
192.168.33.11
To define the variable myVar6, change this file as follows.
[servers]
192.168.33.10 myVar6=10
192.168.33.11 myVar6=11
Note that behind each host, we have added the variable name along with its value which is specific per host. If you now run this playbook with a command like
export ANSIBLE_HOST_KEY_CHECKING=False
ansible-playbook  \
        -u vagrant \
        --private-key ~/vagrant/vagrant_key \
        -i ~/vagrant/hosts.ini \
         definingVariables.yaml
then the last task will produce an output that contains a list of all variables along with their values. You will see that myVar6 has the value defined in the inventory, that myVar5 is in fact different for each host and that all other variables have the values defined in the playbook.
As mentioned before, it is also possible to define variables using an argument to the ansible-playbook executable. If, for instance, you use the following command to run the playbook
export ANSIBLE_HOST_KEY_CHECKING=False
ansible-playbook  \
        -u vagrant \
        --private-key ~/vagrant/vagrant_key \
        -i ~/vagrant/hosts.ini \
        -e myVar4=789 \
         definingVariables.yaml
then the output will change and the variable myVar4 has the value 789. This is an example of the precedence rule mentioned above – an assignment specified on the command line overwrites all other definitions.
Using facts and special variables
So far we have been using variables that we instantiate and to which we assign values. In addition to these custom variables, Ansible will create and populate a few variables for us.
First, for every machine in the inventory to which Ansible connects, it will create a complex data structure called ansible_facts which represents data that Ansible collects on the machine. To see an example, run the command (assuming again that you use the setup from my last post)
export ANSIBLE_HOST_KEY_CHECKING=False
ansible \
      -u vagrant \
      -i ~/vagrant/hosts.ini \
      --private-key ~/vagrant/vagrant_key  \
      -m setup all
This will print a JSON representation of the facts that Ansible has gathered. We see that facts include information on the machine like the number of cores and hyperthreads per core, the available memory, the IP addresses, the devices, the machine ID (which we have used in our example above), environment variables and so forth. In addition, we find some information on the user that Ansible is using to connect, the used Python interpreter and the operating system installed.
It is also possible to add custom facts by placing a file with key-value pairs in a special directory on the host. Confusingly, this is called local facts, even though these facts are not defined on the control machine on which Ansible is running but on the host that is provisioned. Specifically, a file in /etc/ansible/facts.d ending with .fact can contain key-value pairs that are interpreted as facts and added to the dictionary ansible_local.
Suppose, for instance, that on one of your hosts, you have created a file called /etc/ansible/facts.d/myfacts.fact with the following content
[test]
testvar=1
If you then run the above command again to gather all facts, then, for that specific host, the output will contain a variable
"ansible_local": {
            "myfacts": {
                "test": {
                    "testvar": "1"
                }
            }
So we see that ansible_local is a dictionary, with the keys being the names of the files in which the facts are stored (without the extension). The value for each of the files is again a dictionary, where the key is the section in the facts file (the one in brackets) and the value is a dictionary with one entry for each of the variables defined in this section (you might want to consult the Wikipedia page on the INI file format).
In addition to facts, Ansible will populate some special variables like the inventory_hostname, or the groups that appear in the inventory file.
Using variables – Jinja2 templates
In the example above, we have used variables in the debug statement to print their value. This, of course, is not a typical usage. In general, you will want to expand a variable to use it at some other point in your playbook. To this end, Ansible uses Jinja2 templates.
Jinja2 is a very powerful templating language and Python library, and we will only be able to touch on some of its features in this post. Essentially, Jinja2 accepts a template and a set of Python variables and then renders the template, substituting special expressions according to the values of the variables. Jinja2 differentiates between expressions which are evaluated and replaced by the values of the variables they refer to, and tags which control the flow of the template processing, so that you can realize things like loops and if-then statements.
Let us start with a very simple and basic example. In the above playbook, we have hard-coded the name of our variable file vars.yaml. As mentioned above, it is sometimes useful to use different variable files, depending on the environment. To see how this can be done, change the start of our playbook as follows.
---
- hosts: all
  become: yes
  # We can define a variable on the level of a play, it is
  # then valid for all hosts to which the play applies
  vars:
    myVar1: "Hello"
  vars_files:
  - "{{ myfile }}"
When you now run the playbook again, the execution will fail and Ansible will complain about an undefined variable. To fix this, we need to define the variable myfile somewhere, say on the command line.
export ANSIBLE_HOST_KEY_CHECKING=False
ansible-playbook  \
        -u vagrant \
        --private-key ~/vagrant/vagrant_key \
        -i ~/vagrant/hosts.ini \
        -e myVar4=789 \
        -e myfile=vars.yaml \
         definingVariables.yaml
What happens is that before executing the playbook, Ansible will run the playbook through the Jinja2 templating engine. The expression {{myfile}} is the most basic example of a Jinja2 expression and evaluates to the value of the variable myfile. So the entire expression gets replaced by vars.yaml and Ansible will read the variables defined there.
Simple variable substitution is probably the most commonly used feature of Jinja2. But Jinja2 can do much more. As an example, let us modify our playbook so that we use a certain value for myVar7 in DEV and a different value in PROD. The beginning of our playbook now looks as follows (everything else is unchanged):
---
- hosts: all
  become: yes
  # We can define a variable on the level of a play, it is
  # then valid for all hosts to which the play applies
  vars:
    myVar1: "Hello"
    myVar7: "{% if myEnv == 'DEV' %} A {% else %} B {% endif %}"
Let us run this again. On the command line, we set the variable myEnv to DEV.
export ANSIBLE_HOST_KEY_CHECKING=False
ansible-playbook  \
        -u vagrant \
        --private-key ~/vagrant/vagrant_key \
        -i ~/vagrant/hosts.ini \
        -e myVar4=789 \
        -e myEnv=DEV \
         definingVariables.yaml
In the output, you will see that the value of the variable is ” A “, as expected. If you use a different value for myEnv, you get ” B “. The characters “{%” instruct Jinja2 to treat everything that follows (until “%}”) as tag. Tags are comparable to statements in a programming language. Here, we use the if-then-else tag which evaluates to a value depending on a condition.
Jinja2 comes with many tags, and I advise you to browse the documentation of all available control structures. In addition to control structures, Jinja2 also uses filters that can be applied to variables and can be chained.
To see this in action, we turn to an example which demonstrates a second common use of Jinja2 templates with Ansible apart from using them in playbooks – the template module. This module is very similar to the copy module, but it takes a Jinja2 template on the control machine and does not only copy it to the remote machine, but also evaluates it.
Suppose, for instance, you wanted to dynamically create a web page on the remote machine that reflects some of the machines’s characteristics, as captured by the Ansible facts. Then, you could use a template that refers to facts to produce some HTML output. I have created a playbook that demonstrates how this works – this playbook will install NGINX in a Docker container and dynamically create a webpage containing machine details. If you run this playbook with our Vagrant based setup and point your browser to http://192.168.33.10/, you will see a screen similar to the one below, displaying things like the number of CPU cores in the virtual machine or the network interfaces attached to it.
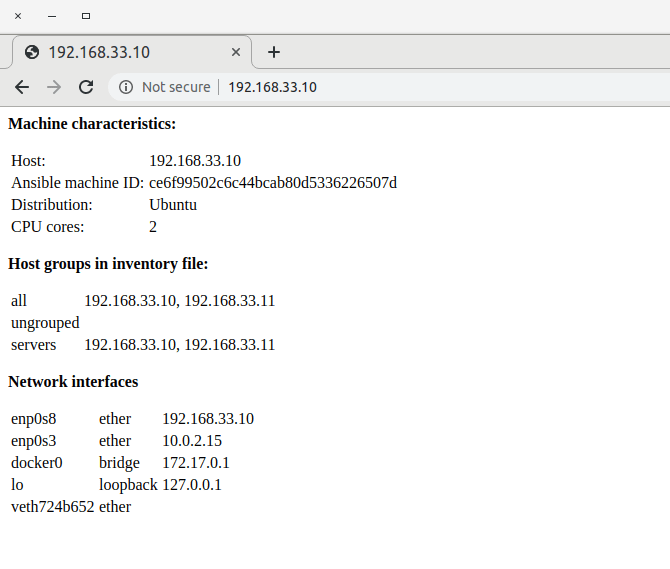
I will not go through this in detail, but I advise you to try out the playbook and take a look at the Jinja2 template that it uses. I have added a few comments which, along with the Jinja2 documentation, should give you a good idea how the evaluation works.
To close this post, let us see how we can test Jinja2 templates. Of course, you could simply run Ansible, but this is a bit slow and creates an overhead that you might want to avoid. As Jinja2 is a Python library, there is a much easier approach – you can simply create a small Python script that imports your template, runs the Jinja2 engine and prints the result. First, of course, you need to install the Jinja2 Python module.
pip3 install jinja2
Here is an example of how this might work. We import the template index.html.j2 that we also use for our dynamic webpage displayed above, define some test data, run the engine and print the result.
import jinja2
#
# Create a Jinja2 environment, using the file system loader
# to be able to load templates from the local file system
#
env = jinja2.Environment(
    loader=jinja2.FileSystemLoader('.')
)
#
# Load our template
#
template = env.get_template('index.html.j2')
#
# Prepare the input variables, as Ansible would do it (use ansible -m setup to see
# how this structure looks like, you can even copy the JSON output)
#
groups = {'all': ['127.0.0.1', '192.168.33.44']}
ansible_facts={
        "all_ipv4_addresses": [
            "10.0.2.15",
            "192.168.33.10"
        ],
        "env": {
            "HOME": "/home/vagrant",
        },
        "interfaces": [
            "enp0s8"
        ],
        "enp0s8": {
            "ipv4": {
                "address": "192.168.33.11",
                "broadcast": "192.168.33.255",
                "netmask": "255.255.255.0",
                "network": "192.168.33.0"
            },
            "macaddress": "08:00:27:77:1a:9c",
            "type": "ether"
        },
}
#
# Render the template and print the output
#
print(template.render(groups=groups, ansible_facts=ansible_facts))
An additional feature that Ansible offers on top of the standard Jinja2 templating language and that is sometimes useful are lookups. Lookups allow you to query data from external sources on the control machine (where they are evaluated), like environment variables, the content of a file, and many more. For example, the expression
"{{ lookup('env', 'HOME') }}"
in a playbook or a template will evaluate to the value of the environment variable HOME on the control machine. Lookups are enabled by plugins (the name of the plugin is the first argument to the lookup statement), and Ansible comes with a large number of pre-installed lookup plugins.
We have now discussed Ansible variables in some depth. You might want to read through the corresponding section of the Ansible documentation which contains some more details and links to additional information. In the next post, we will turn our attention back from playbooks to inventories and how to structure and manage them.