
In the previous post, we have sketched the basic ideas behind NMR based quantum computation. In this post, we will discuss single qubits and single qubit operations in more depth.
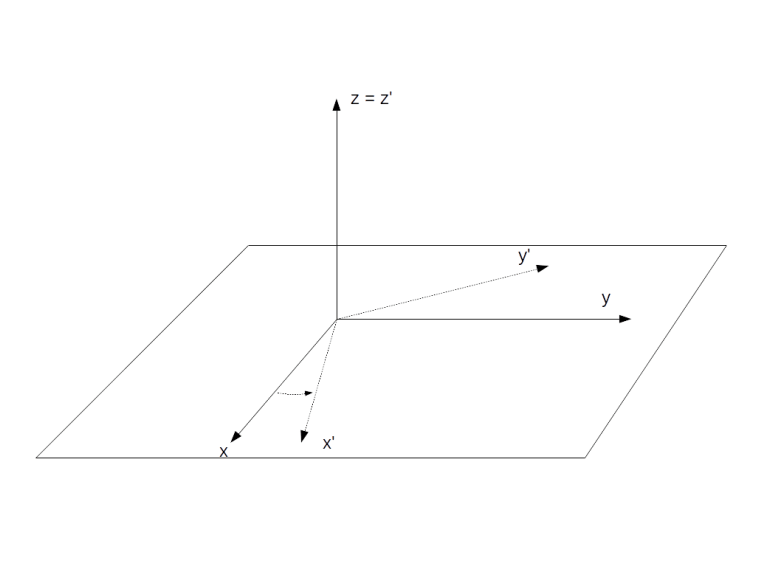
The rotating frame of reference
In NMR based quantum computing, quantum gates are realized by applying oscillating magnetic fields to our probe. As an oscillating field is time dependent, the Hamiltonian will be time dependent as well, making some calculations a bit more difficult. To avoid this, it is useful to pass to a different frame of reference, called the rotating frame of reference.
To explain this, let us first study a more general setting. Assume that we are looking at a quantum system with Hamiltonian H and a state vector 

with a hermitian matrix A. We can then consider the transformed vector

Using the product rule and the Schrödinger equation, we can easily calculate the time derivative of this vector and obtain

with
In other words, the transformed vector again evolves over time according to an equation which is formally a Schrödinger equation if we replace the original Hamiltonian by the transformed Hamiltonian 
Let us now apply this to the system describing a single nuclear spin with spin 1/2 in a constant magnetic field B along the z-axis of the laboratory system. In the laboratory frame, the Hamiltonian is then given by

with the Larmor frequency 

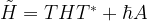
We now pass into a new frame of reference by applying the transformation
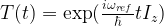
with an arbitratily chosen reference frequency 

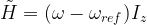
This is of the same form as the original Hamiltonian, with a corrected Larmor frequency

In particular, the Hamiltonian is trivial if the reference frequency is equal to the Larmor frequency.
Intuitively, this is easy to understand. We know that the time evolution in the laboratory frame is described by a precession with the frequency 

Let us now repeat this for a different Hamiltonian – the Hamiltonian that governs the time evolution in the presence of an oscillating magnetic field. More precisely, we will look at the Hamiltonian of a rotating magnetic field (which is a good approximation for an oscillating magnetic field by an argument known as rotating wave approximation, see my notes for more details on this). In the presence of such a field, the Hamiltonian in the laboratory frame is
![H = \omega I_z + \omega_{nut} [I_x \cos (\omega_{ref}t + \Phi_p) + I_y \sin (\omega_{ref}t + \Phi_p) ]](https://s0.wp.com/latex.php?latex=H+%3D+%5Comega+I_z+%2B+%5Comega_%7Bnut%7D+%5BI_x+%5Ccos+%28%5Comega_%7Bref%7Dt+%2B+%5CPhi_p%29+%2B+I_y+%5Csin+%28%5Comega_%7Bref%7Dt+%2B+%5CPhi_p%29+%5D++&bg=FFFFFF&fg=000&s=1&c=20201002)
To calculate the Hamiltonian in the rotating frame, we have – according to the above formula – to apply the conjugation with T to each of the terms appearing in this Hamiltonian and add a correction term.
Now the transformation T is a rotation around the z-axis, and the result of applying a rotation around the z-axis to the operators Ix and Iy is well known and in fact easy to calculate using the commutation relations between the Pauli matrices. The correction term cancels the first term of the Hamiltonian as above. The transformed Hamiltonian is then given by
![\tilde{H} = \omega_{nut} [I_x \cos \Phi_p + I_y \sin \Phi_p ]](https://s0.wp.com/latex.php?latex=%5Ctilde%7BH%7D+%3D+%5Comega_%7Bnut%7D+%5BI_x+%5Ccos+%5CPhi_p+%2B+I_y+%5Csin+%5CPhi_p+%5D++&bg=FFFFFF&fg=000&s=1&c=20201002)
In other words, the time dependence has disappeared and only the phase term remains. Again, this is not really surprising – if we look at a rotating magnetic field from a frame of reference that is rotating around the same axis with the same frequency, the result is a constant magnetic field.
The density matrix of a single qubit
We are now ready to formally describe a single qubit, given by all nuclei at a specific position in a system consisting of a large number of molecules. According to the formalism of statistical quantum mechanics, this ensemble is described by a 2×2 density matrix 
![i\hbar \frac{d}{dt} \rho = [H,\rho]](https://s0.wp.com/latex.php?latex=i%5Chbar+%5Cfrac%7Bd%7D%7Bdt%7D+%5Crho+%3D+%5BH%2C%5Crho%5D++&bg=FFFFFF&fg=000&s=1&c=20201002)
The density matrix is a hermitian matrix with trace 1. Therefore the matrix 

where f is a three-vector with real coefficients and the dot product is a shorthand notation for

Similarly, the most general time-independent Hamiltonian can be written as

We can remove the trace by adding a constant, which does not change the physics and corresponds to a shift of the energy scale. Further, we can express the vector a as the product of a unit vector and a scalar. Thus the most general Hamiltonian we need to consider is

with a real number 
Let us now plug this into the Liouville equation. Applying the very useful general identity (which is easily proved by a direct calculation)
![[a\cdot I, b \cdot I] = i \hbar (a \times b) \cdot I](https://s0.wp.com/latex.php?latex=%5Ba%5Ccdot+I%2C+b+%5Ccdot+I%5D+%3D+i+%5Chbar+%28a+%5Ctimes+b%29+%5Ccdot+I++&bg=FFFFFF&fg=000&s=1&c=20201002)
for any two vectors a and b, we find that
![\dot{f} = - \omega_{eff} [f \times n]](https://s0.wp.com/latex.php?latex=%5Cdot%7Bf%7D+%3D+-+%5Comega_%7Beff%7D+%5Bf+%5Ctimes+n%5D++&bg=FFFFFF&fg=000&s=1&c=20201002)
This equation is often called the Bloch equation. By splitting f into a component perpendicular to n and a component parallel to n, one can easily see that the solution is a rotation around the axis n with frequency
What is the physical interpretation of this result and the physical meaning of f? To see this, let us calculate the expectation value of the magnetic moment induced by the spin of our system. The x-component of the magnetic moment, for instance, corresponds to the observable 


If we compute the matrix product 
Similar calculations work for the other components and we find that, up to a constant, the vector f is the net magnetic moment of the probe.
A typical NMR experiment
After all these preparations, we now have all tools at our disposal to model the course of events during a typical NMR experiment in terms of the density matrix.
Let us first try to understand the initial state of the system. In a real world experiment, none of the qubits is fully isolated. In addition, the qubits interact, and they interact with the surroundings. We can model these interactions by treating the qubits as being in contact with a heat bath of constant temperature T. According to the rules of quantum statistical mechanics, the equilibrium state, i.e. the state into which the system settles down after some time, is given by the Boltzmann distribution, i.e.

In the absence of an additional rotating field, the Hamiltonian in the laboratory frame is given by
Therefore

Using the relations
and

with the gyromagnetic moment 

Let us now introduce the energy ratio

The energy in the numerator is the energy scale associated with the Larmor frequency. For a proton in a magnetic field of a few Tesla, for example, this will be in the order of 10-25 Joule. The energy in the denominator is the thermal energy. If the experiment is conducted at room temperature, say T=300K, then this energy is in the order of 10-21 Joule (see this notebook for some calculations). This yields a value of roughly 10-4 for 
called the high temperature approximation. We can determine the value of Z by calculating the trace and find that Z = 2, so that

If we compare this to the general form of the density matrix discussed above, we find that the thermal state has a net magnetization in the direction of the z-axis (for positive
To calculate how this state changes over time, we again pass to the rotating frame of reference. As the initial density matrix clearly commutes with the rotation around the z-axis, the density matrix in the rotating frame is the same. If we choose the reference frequency to be exactly the Larmor frequency, the Hamiltonian given by the static magnetic field along the z-axis vanishes, and the density matrix does not change over time.
When, however, we apply an additional pulse, i.e. an additional rotating magnetic field, for some time 

to the Hamiltonian. This has the form discussed above – a scalar times a dot product of a unit vector with the vector I = (Ix, Iy, Iz). Therefore, we find that the time evolution induced by this Hamiltonian is a rotation around the vector

with the frequency 


the net magnetization will be parallel to the y-axis. After the pulse has been turned off, the density matrix in the rotating frame is again constant, so the magnetic moment stays along the y-axis. In the laboratory frame, however, this corresponds to a magnetic moment which rotates with the Larmor frequency around the z-axis. This magnetic moment will induce a voltage in a coil placed in the x-y-plane which can be measured. The result will be an oscillating current, with frequency equal to the Larmor frequency. Over time, the state will slowly return into the thermal equilibrium, resulting in a decay of the oscillation.
This is a good point in time to visualize what is happening. Given the explicit formulas for the density matrix derived above, it is not difficult to numerically simulate the state changes and NMR signals during an experiment as the one that we have just described (if you want to take a look at the required code, you can find a Python notebook here)
The diagram below shows the result of such a simulation. Here, we have simulated a carbon nucleus in a TCE (Trichloroethylene) molecule. This molecule – pictured below (source Wikipedia) – has two central carbon nuclei.

A small percentage of all TCE molecules in a probe will have two 13C nuclei instead of the more common 12C nuclei, which have spin 1/2 and therefore should be visible in the NMR spectrum. At 11.74 Tesla, an isolated 13C carbon nucleus has a Larmor precession frequency of 125 MHz. However, when the nuclei are part of a larger molecule as in our case, each nucleus is shielded from an external magnetic field by the surrounding cloud of electrons. As the electron configuration for both nuclei is different, the observed Larmor frequencies differ by a small amount known as the chemical shift.
At the start of the simulation, the system was put into a thermal state. Then, an RF pulse was applied to flip the magnetization in the direction of the x-axis, and then a sample was taken over 0.1 seconds, resulting in the following signal.
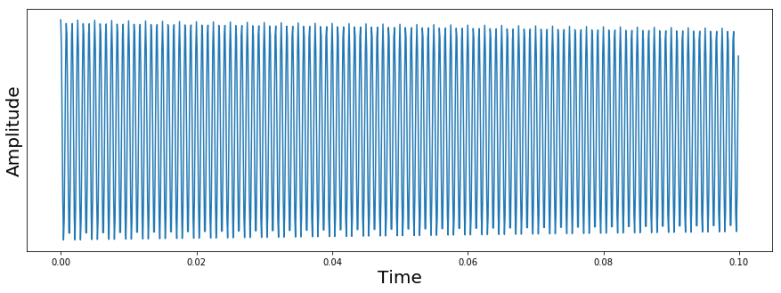
The signal that we see looks at the first glance as expected. We see an oscillating signal with an amplitude that is slowly decaying. However, you might notice that the frequency of the oscillation is clearly not 125 MHz. Instead, the period is roughly 0.001 seconds, corresponding to a frequency of 1200 Hz. The reason for this is that in an NMR spectrometer, the circuit processing the received signal will typically apply a combination of a mixer and a low pass filter to effectively shift the frequency by an adjustable reference frequency. In our case, the reference frequency was adjusted to be 1200 Hz above the Larmor frequency of the carbon nucleus, so the signal will oscillate with a frequency of 1200 Hz. In practice, the reference frequency determines a window in the frequency space in which we can detect signals, and all frequencies outside this window will be suppressed by the low pass filter.
Now let us take a look at a more complicated signal. We again place the system in the thermal equilibrium state first, but then apply RF pulses to flip the spin of both carbon nuclei into the x-axis (in a simulation, this is easy, in a real experiment, this requires some thought, as the Larmor frequencies of these two carbon nuclei differ only by a small chemical shift of 900 Hz). We then again take a sample and plot the signal. The result is shown below.
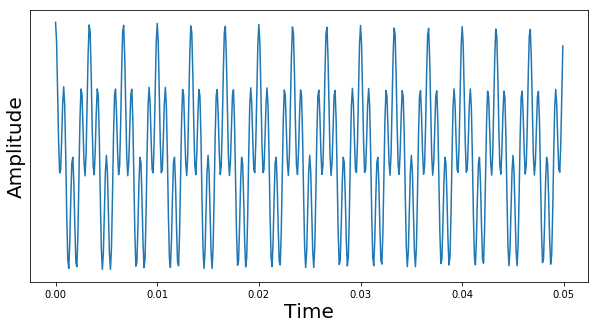
This time, we see a superposition of two oscillations. The first oscillations is what we have already seen – an oscillation with 1200 Hz, which is the difference of the chosen reference frequency and the Larmor frequency of the first carbon. The second oscillation corresponds to a frequency of roughly 300 Hz. This is the signal caused by the Larmor precession of the second spin. As we again measure the difference between the real frequency and the reference frequency, we can conclude that this frequency differs from the Larmor frequency of the first spin by 900 Hz.
In reality, the signal that we observe is the superposition of many different oscillations and is not easy to interpret – even with a few oscillations, it soon becomes impossible to extract the frequencies by a graphical analysis as we have done it so far. Instead, one usually digitizes the signal and applies a Fourier transform (or, more precisely, a discrete Fourier transform). The following diagram shows the result of applying such a DFT to the signal above.
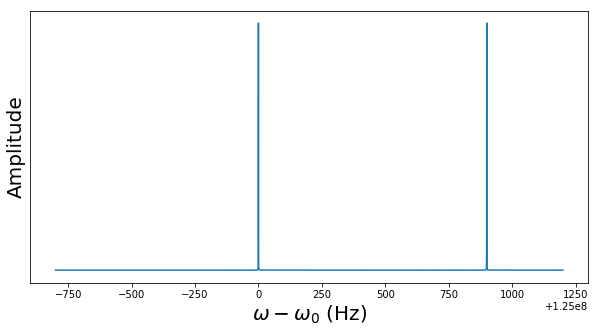
Here, we have shifted the x-axis by the difference between the Larmor frequency 
Let us quickly summarize what we have learned. An ensemble of spin systems is described by a density which in turn is given by the net magnetization vector f. The result of applying a pulse to this state is a rotation around an axis given by the phase of the pulse (in fact, the phase can be adjusted to rotate around any axis in the x-y-plane, and as any rotation can be written as a decomposition of such rotations, we can generate an arbitrary rotation). The net magnetization can be measured by placing a coil close to the probe and measuring the induced voltage.
This does already look like we are able to produce a reasonable single qubit. The vector f appears to correspond – after some suitable normalization – to points on the Bloch sphere, and as we can realize rotations, we should be able to realize arbitrary single qubit quantum gates. But what about multiple qubits? Of course a molecule typically has more than one nucleus, and we could try to use additional nuclei to create additional qubits, but there is a problem – in order to realize multi-qubit gates, these qubits have to interact. In addition, we need to be able to prepare our NMR system in a useful initial state and, at the end of the computation, we need to measure the outcome. These main ingredients of NMR based quantum computing will be the subject of the next post.

Fascinating post. Just a small point – the illustrated molecule appears to be trichloroethane, not trichloroethylene.
LikeLike
Good catch, of course you are right. Thanks for pointing that out, I fixed the link
LikeLike