Building a bitcoin controller for Kubernetes part II – code generation and event handling

In this post, we will use the Kubernetes code generator to create client code and informers which will allow us to set up the basic event handlers for our customer controller.

Before we start to dig into this, note that compared to my previous post, I had to make a few changes to the CRD definition to avoid dashes in the name of the API group. The updated version of the CRD definition looks as follows.

apiVersion: apiextensions.k8s.io/v1beta1
kind: CustomResourceDefinition
metadata:
    name: bitcoinnetworks.bitcoincontroller.christianb93.github.com
spec:
    version: v1
    group: bitcoincontroller.christianb93.github.com
    scope: Namespaced
    subresources:
      status: {}
    names:
      plural: bitcoinnetworks
      singular: bitcoinnetwork
      kind: BitcoinNetwork
    validation:
      openAPIV3Schema:
        properties:
          spec:
            required:
            - nodes
            properties:
              nodes:
                type: integer

Step 5: running the code generators

Of course we will use the Kubernetes code generator to generate the code for the clientset and the informer. To use the code generator, we first need to get the corresponding packages from the repository.

$ go get k8s.io/code-generator
$ go get k8s.io/gengo

The actual code generation takes place in three steps. In each step, we will invoke one of the Go programs located in $GOPATH/src/k8s.io/code-generator/cmd/ to create a specific set of objects. Structurally, these programs are very similar. They accept a parameter that specifies certain input packages that are scanned. They then look at every structure in these packages and detect tags, i.e. comments in a special format, to identify those objects for which they need to create code. Then they place the resulting code in an output package that we need to specify.

Fortunately, we only need to prepare three inputs files for the code generation – the first one is actually scanned by the generators for tags, the second and third file have to be provided to make the generated code compile.

  • In the package apis/bitcoincontroller/v1, we need to provide a file types.go in which define the Go structures corresponding to our CRD – i.e. a BitcoinNetwork, the corresponding list type BitcoinNetworkList, a BitcoinNetworkSpec and a BitcoinNetworkStatus. This is also the file in which we need to place our tags (as the scan is based on package structures, we could actually call our file however we want, but following the usual conventions makes it easier for third parties to read our code)
  • In the same directory, we will place a file register.go. This file defines some functions that will later be called by the generated code to register our API group and version with a scheme
  • Finally, there is a second file register.go which is placed in apis/bitcoincontroller and defines a constant representing the fully qualified name of the API group

We first start with the generator that creates the code to create deep copies for our API objects. In this case, we mark the structures for which code should be generated with the tag +k8s.deepcopy-gen=true (which we could also do on package level). As we also want to create DeepCopyObject() methods for these structures, we also add the additional tags

+k8s:deepcopy-gen:interfaces=k8s.io/apimachinery/pkg/runtime.Object

Then we invoke the code generator using

go run $GOPATH/src/k8s.io/code-generator/cmd/deepcopy-gen/main.go \
  --bounding-dirs github.com/christianb93/bitcoin-controller/internal/apis \
  --input-dirs github.com/christianb93/bitcoin-controller/internal/apis/bitcoincontroller/v1

By default, the generator will place its results in a file deepcopy_generated.go in the input directory. If you run the controller and open the file, you should find the generated code which is not hard to read and does in fact simply create deep copies. For a list, for instance, it creates a new list and copies item by item. As our structures are not deeply nested, the code is comparatively straightforward. If something goes wrong, you can add the switch --v 5 to increase the log level and obtain additional debugging output.

The second code generator that we will use is creating the various clients that we need – a clientset for our new API group and a client for our new resource. The structure of the command is similar, but this time, we place the generated code in a separate directory.

go run $GOPATH/src/k8s.io/code-generator/cmd/client-gen/main.go \
  --input-base "github.com/christianb93/bitcoin-controller/internal/apis" \
  --input "bitcoincontroller/v1" \
  --output-package "github.com/christianb93/bitcoin-controller/internal/generated/clientset" \
  --clientset-name "versioned"

The first two parameters taken together define the package that is scanned for tagged structures. This time, the magic tag that will cause a structure to be considered for code generation is +genclient. The third parameter and the fourth parameters similarly define where the output will be placed in the Go workspace. The actual package name will be formed from this output path by appending the name of the API group and the version. Make sure to set this variable, as the default will point into the Kubernetes package and not into your own code tree (it took me some time to figure out the exact meaning of all these switches and a few failed attempts plus some source code analysis – but this is one of the beauties of Go – all the source code is at your fingertip…)

When you run this command, it will place a couple of files in the directory $GOPATH/src/github.com/christianb93/bitcoin-controller/internal/generated/clientset. With these files, we have now all the code in place to handle our objects via the API – we can create, update, get and list our bitcoin networks. To list all existing bitcoin networks, for instance, the following code snippet will work (I have skipped some of the error handling code to make this more readable).

import (
	"fmt"
	"path/filepath"

	bitcoinv1 "github.com/christianb93/bitcoin-controller/internal/apis/bitcoincontroller/v1"
	clientset "github.com/christianb93/bitcoin-controller/internal/generated/clientset/versioned"
	"k8s.io/client-go/tools/clientcmd"
	"k8s.io/client-go/util/homedir"
)

home := homedir.HomeDir()
kubeconfig := filepath.Join(home, ".kube", "config")
config, err := clientcmd.BuildConfigFromFlags("", kubeconfig)
// Create BitcoinNetwork client set
c, err := clientset.NewForConfig(config)
client := c.BitcoincontrollerV1()
list, err := client.BitcoinNetworks("default").List(metav1.ListOptions{})
for _, item := range list.Items {
	fmt.Printf("Have item %s\n", item.Name)
}

This code is very similar to the code that we have used in one of our first examples to list pods and nodes, with the only difference that we are now using our generated packages to create a clientset. I have written a few tests to verify that the generated code works.

To complete our code generation, we now have to generate listers and informers. The required commands will first generate the listers package and then the informers package that uses the listers.

go run $GOPATH/src/k8s.io/code-generator/cmd/lister-gen/main.go \
  --input-dirs  "github.com/christianb93/bitcoin-controller/internal/apis/bitcoincontroller/v1"\
  --output-package "github.com/christianb93/bitcoin-controller/internal/generated/listers"

go run $GOPATH/src/k8s.io/code-generator/cmd/informer-gen/main.go \
  --input-dirs  "github.com/christianb93/bitcoin-controller/internal/apis/bitcoincontroller/v1"\
  --versioned-clientset-package "github.com/christianb93/bitcoin-controller/internal/generated/clientset/versioned"\
  --listers-package "github.com/christianb93/bitcoin-controller/internal/generated/listers"\
  --output-package "github.com/christianb93/bitcoin-controller/internal/generated/informers"

You can find a shell script that runs all necessary commands here.

Again, we can now use our listers and informers as for existing API objects. If you want to try this out, there is also a small test set for this generated code.

Step 6: writing the controller skeleton and running first tests

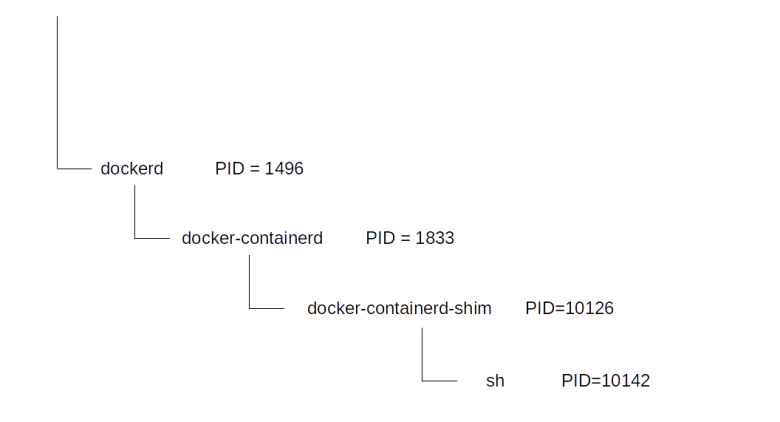
We can now implement most of the code of the controller up to the point where the actual business logic kicks in. In main.go, we create a shared informer and a controller object. Within the controller, we add event handlers to this informer that put the events onto a work queue. Finally, we create worker threads that pop the events off the queue and trigger the actual business logic (which we still have to implement). If you have followed my previous posts, this code is straightforward and does not contain anything new. Its structure at this point in time is summarized in the following diagram.

BitcoinControllerStructureI

We are now in a position to actually run our controller and test that the event handlers are called. For that purpose, clone my repository into your workspace, make sure that the CRD has been set up correctly in your cluster and start the controller locally using

$ go run $GOPATH/src/github.com/christianb93/bitcoin-controller/cmd/controller/main.go --kubeconfig "$HOME/.kube/config"

You should now see a few messages telling you that the controller is running and has entered its main loop. Then, in a second terminal, create a test bitcoin network using

$ kubectl apply -f https://raw.githubusercontent.com/christianb93/bitcoin-controller/master/deployments/testNetwork.yaml

You should now see that the ADD handler has been called and see a message that the worker thread has popped the resulting event off the work queue. So our message distribution scheme works! You will also see that even though there are no further changes, update events are published every 30 seconds. The reason for this behaviour is that the cache is resynced every 30 seconds which will push the update events. This can be useful to make sure that a reconciliation is done every 30 seconds, which might heal a potentially incorrect state which was the result of an earlier error.

This is nice, but there is a problem which becomes apparent if you now try to package our code in a container and run it inside the cluster as we have done it at the end of our previous post. This will not produce the same output, but error messages ending with “cannot list resource “bitcoinnetworks” in API group “bitcoincontroller.christianb93.github.com” at the cluster scope”.

The reason for this is that the pod is running with the default service account, and this account does not have the privileges to read our resources. In the next post, we will see how role based access control comes to the rescue.

As before, I have created the tag v0.2 to reflect the status of the code at the end of this post.

Building a bitcoin controller for Kubernetes part I – the basics

As announced in a previous post, we will, in this and the following posts, implement a bitcoin controller for Kubernetes. This controller will be aimed at starting and operating a bitcoin test network and is not designed for production use.

Here are some key points of the design:

  • A bitcoin network will be specified by using a custom resource
  • This definition will contain the number of bitcoin nodes that the controller will bring up. The controller will also talk to the individual bitcoin daemons using the Bitcon JSON RPC API to make the nodes known to each other
  • The controller will monitor the state of the network and maintain a node list which is part of the status subresource of the CRD
  • The bitcoin nodes are treated as stateful pods (i.e. controlled by a stateful set), but we will use ephemeral storage for the sake of simplicity
  • The individual nodes are not exposed to the outside world, and users running tests against the cluster either have to use tunnels or log into the pod to run tests there – this is of course something that could be changed in a future version

The primary goal of writing this operator was not to actually run it in real uses cases, but to demonstrate how Kubernetes controllers work under the hood… Along the way, we will learn a bit about building a bitcoin RPC client in Go, setting up and using service accounts with Kubernetes, managing secrets, using and publishing events and a few other things from the Kubernetes / Go universe.

Step 1: build the bitcoin Docker image

Our controller will need a Docker image that contains the actual bitcoin daemon. At least initially, we will use the image from one of my previous posts that I have published on the Docker Hub. If you decide to use this image, you can skip this section. If, however, you have your own Docker Hub account and want to build the image yourself, here is what you need to do.

Of course, you will first need to log into Docker Hub and create a new public repository.
You will also need to make sure that you have a local version of Docker up and running. Then follow the instructions below, replacing christianb93 in all but the first lines with your Docker Hub username. This will

  • Clone my repository containing the Dockerfile
  • Trigger the build and store the resulting image locally, using the tag username/bitcoind:latest – be patient, the build can take some time
  • Log in to the Docker hub which will store your credentials locally for later use by the docker command
  • Push the tagged image to the Docker Hub
  • Delete your credentials again
$ git clone https://github.com/christianb93/bitcoin.git
$ cd bitcoin/docker 
$ docker build --rm -f Dockerfile -t christianb93/bitcoind:latest .
$ docker login
$ docker push christianb93/bitcoind:latest
$ docker logout

Step 2: setting up the skeleton – logging and authentication

We are now ready to create a skeleton for our controller that is able to start up inside a Kubernetes cluster and (for debugging purposes) locally. First, let us discuss how we package our code in a container and run it for testing purposes in our cluster.

The first thing that we need to define is our directory layout. Following standard conventions, we will place our code in the local workspace, i.e. the $GOPATH directory, under $GOPATH/src/github.com/christianb93/bitcoin-controller. This directory will contain the following subdirectories.

  • internal will contain our packages as they are not meant to be used outside of our project
  • cmd/controller will contain the main routine for the controller
  • build will contain the scripts and Dockerfiles to build everything
  • deployments will holds all manifest files needed for the deployment

By default, Go images are statically linked against all Go specific libraries. This implies that you can run a Go image in a very minimal container that contains only C runtime libraries. But we can go even further and ask the Go compiler to also statically link the C runtime library into the Go executable. This executable is then independent of any other libraries and can therefore run in a “scratch” container, i.e. an empty container. To compile our controller accordingly, we can use the commands

CGO_ENABLED=0 go build
docker build --rm -f ../../build/controller/Dockerfile -t christianb93/bitcoin-controller:latest .

in the directory cmd/controller. This will build the controller and a docker image based on the empty scratch image. The Dockerfile is actually very simple:

FROM scratch

#
# Copy the controller binary from the context into our
# container image
#
COPY controller /
#
# Start controller
#
ENTRYPOINT ["/controller"]

Let us now see how we can run our controller inside a test cluster. I use minikube to run tests locally. The easiest way to run own images in minikube is to build them against the docker instance running within minikube. To do this, execute the command

eval $(minikube docker-env)

This will set some environment variables so that any future docker commands are directed to the docker engine built into minikube. If we now build the image as above, this will create a docker image in the local repository. We can run our image from there using

kubectl run bitcoin-controller --image=christianb93/bitcoin-controller --image-pull-policy=Never --restart=Never

Note the image pull policy – without this option, Kubernetes would try to pull the image from the Docker hub. If you do not use minikube, you will have to extend the build process by pushing the image to a public repository like Docker hub or a local repository reachable from within the Kubernetes cluster that you use for your tests and omit the image pull policy flag in the command above. We can now inspect the log files that our controller writes using

kubectl logs bitcoin-controller

To implement logging, we use the klog package. This will write our log message to the standard output of the container, where they are picked up by the Docker daemon and forwarded to the Kubernetes logging system.

Our controller will need access to the Kubernetes API, regardless of whether we execute it locally or within a Kubernetes cluster. For that purpose, we use a command-line argument kubeconfig. If this argument is set, it refers to a kubectl config file that is used by the controller. We then follow the usual procedure to create a clientset.

In case we are running inside a cluster, we need to use a different mechanism to obtain a configuration. This mechanism is based on a service accounts.

Essentially, service accounts are “users” that are associated with a pod. When we associate a service account with a pod, Kubernetes will map the credentials that authenticate this service account into /var/run/secrets/kubernetes.io/serviceaccount. When we use the helper function clientcmd.BuildConfigFromFlags and pass an empty string as configuration file, the Go client will fall back to in-cluster configuration and try to retrieve the credentials from that location. If we do not specify a service account for the pod, a default account is used. This is what we will do for the time being, but we will soon run into trouble with this approach and will have to define a service account, an RBAC role and a role binding to grant permissions to our controller.

Step 3: create a CRD

Next, let us create a custom resource definition that describes our bitcoin network. This definition is very simple – the only property of our network that we want to make configurable at this point in time is the number of bitcoin nodes that we want to run. We do specify a status subresource which we will later use to track the status of the network, for instance the IP addresses of its nodes. Here is our CRD.

apiVersion: apiextensions.k8s.io/v1beta1
kind: CustomResourceDefinition
metadata:
    name: bitcoin-networks.bitcoin-controller.christianb93.github.com
spec:
    version: v1
    group: bitcoin-controller.christianb93.github.com
    scope: Namespaced
    subresources:
      status: {}
    names:
      plural: bitcoin-networks
      singular: bitcoin-network
      kind: BitcoinNetwork
    validation:
      openAPIV3Schema:
        properties:
          spec:
            required:
            - nodes
            properties:
              nodes:
                type: int

Step 4: pushing to a public repository and running the controller

Let us now go through the complete deployment cycle once, including the push to a public repository. I assume that you have a user on Docker Hub, (for me, this is christianb93), and have set up a repository called bitcoin-controller in this account. I will also assume that you have done a docker login before running the commands below. Then, building the controller is easy – simply run the following commands, replacing the christianb93 in the last two commands with your username on Docker Hub.

cd $GOPATH/src/github.com/christianb93/bitcoin-controller/cmd/controller
CGO_ENABLED=0 go build
docker build --rm -f ../../build/controller/Dockerfile -t christianb93/bitcoin-controller:latest .
docker push christianb93/bitcoin-controller:latest

Once the push is complete, you can run the controller using a standard manifest file as the one below.

apiVersion: v1
kind: Pod
metadata:
  name: bitcoin-controller
  namespace: default
spec:
  containers:
  - name: bitcoin-controller-ctr
    image: christianb93/bitcoin-controller:latest

Note that this will only pull the image from Docker Hub if we delete the local image using

docker rmi christianb93/bitcoin-controller:latest

from the minikube Docker repository (or did not use that repository at all). You will see that pushing takes some time, this is why I prefer to work with the local registry most of the time and only push to the Docker Hub once in a while.

We now have our build system in place and a working skeleton which we can run in our cluster. This version of the code is available in my GitHub repository under the v0.1 tag. In the next post, we will start to add some meat – we will model our CRD in a Go structure and put our controller in a position to react on newly added bitcoin networks.

Kubernetes storage under the hood part I – ephemeral storage

So far, we have mainly discussed how compute and network resources are used and managed with Kubernetes. We will now turn to the third fundamental element of a container platform – storage.

Docker storage concepts

Before we talk about Kubernetes storage concepts, let us first recall how storage is managed in Docker. The following tests assume that you have a local installation of Docker on a Linux workstation (or virtual machine, of course). As a refresher, you might want to take a look at my introduction into Docker internals before reading on.

First, let us start a Docker container and spawn a shell. The easiest way to do this is the busybox image. So let us spin up a busybox container, attached to the terminal, and run mount to inspect its file system.

$ docker run -it busybox
/ # mount
overlay on / type overlay (rw,relatime,lowerdir=/var/lib/docker/overlay2/l/BNUAN2FS4K75ZLQFSZVQWXRLUU:/var/lib/docker/overlay2/l/UKEGOK4TLTD2T4XN5KIEPN7JXF,upperdir=/var/lib/docker/overlay2/e8f16f0d705fb8e4677b605796b7319ef3f0226e2ad173b506e13b479afa515f/diff,workdir=/var/lib/docker/overlay2/e8f16f0d705fb8e4677b605796b7319ef3f0226e2ad173b506e13b479afa515f/work)
proc on /proc type proc (rw,nosuid,nodev,noexec,relatime)
tmpfs on /dev type tmpfs (rw,nosuid,size=65536k,mode=755)
[REDACTED - SOME LINES REMOVED]

Your output will most likely look differently, but the general pattern will be the same. The first mount point that we see is the mount for the root directory. On newer Docker versions, this will be an overlay2 file system, on older Docker versions, it will be of type aufs. This entry points to one or more actual files on the host system that are located in the directory /var/lib/docker/ which is managed by Docker. These are the files in which the actual content of the root filesystem is stored.

The data on that file system is volatile and linked to the lifecycle of the container. To see this, let us create a file in the containers root file system and exit the container.

/ # echo "dancing in the rain" > /franky
/ # exit

This will stop the container, but not remove it – it will still exist and be visible in the output of docker ps -a. If you restart the container and attach to the running container, you will find that the file is still there and its content has been preserved. If, however, you remove the container using docker rm, the corresponding files on the host file system will be removed and the content of the file system of our container is lost. In that sense, these volumes are ephemeral – they survive across restarts, but die if the container is removed.

But Docker can do more – we can also use persistent storage. One option to do this are bind mounts. A bind mount maps a directory or a file from the host file system into the namespace of the container and attaches it to a mount point. To see an example, create a temporary directory on your host system and put some data into it. We can then mount this directory into a new Docker container using the -v option.

$ mkdir /tmp/ctr-test/
$ echo "Hello World" > /tmp/ctr-test/hello
$ docker run -v /tmp/ctr-test:/ctr-test/ -it busybox 
/ # cat /ctr-test/hello
Hello World
/# exit

So the content of the directory /tmp/ctr-test on the host becomes accessible within the container as /ctr-test (of course I could have chosen any other name as well). We can also see this mount point in the output of docker inspect. Use docker ps -a to find out the ID of the busybox container, in my case fd8ef21ba685, and then run

$ docker inspect fd8ef21ba685 --format="{{json .Mounts}}"
[{"Type":"bind","Source":"/tmp/ctr-test","Destination":"/ctr-test","Mode":"","RW":true,"Propagation":"rprivate"}]

So the mount point shows up as a mount point of type bind in the list of mounts of our container.

We remark that Docker also has a more advanced way to mount storage referred to as volumes. In contrast to a bind mount, a volume is an object managed by Docker, backed by files in the Docker controlled directories. Volumes can be created manually or dynamically, can be given a name and can be mounted into a container. As they are objects with an independent lifecycle, they survive container eviction and can be mounted to more than one container. However, we will not look deeper into this as (at least to my knowledge) this feature is not used by Kubernetes.

Ephemeral storage in Kubernetes

Now let us try out how things change if we use Kubernetes to spin up our containers.

$ kubectl run -i --tty busybox --image=busybox --restart=Never
/ # / # mount
overlay on / type overlay (rw,relatime,lowerdir=/var/lib/docker/overlay2/l/57X3FQLOLATAMPLAASUMBKHD5W:/var/lib/docker/overlay2/l/Q6HSQOG4NX7UHGVZEPQIZI43KQ,upperdir=/var/lib/docker/overlay2/f183dfd193c86bf43ebca4ae7d08cbfd6e268229f3bd59c70be2f48d9dc0937f/diff,workdir=/var/lib/docker/overlay2/f183dfd193c86bf43ebca4ae7d08cbfd6e268229f3bd59c70be2f48d9dc0937f/work)
[REDACTED]

So we see pretty much the same picture. The root volume of the container is again an overlay file system that is backed by directories managed by Docker on the host on which the pod is running.

If, however, you ssh into the node on which the container is running and do a docker inspect as before, you will find that there are actually a couple of bind mounts that we have not explicitly specified. These bind mounts are added by Kubernetes to give the container access to some configuration data like the token that can be used to connect to a Kubernetes service account, or host name resolutions (the own IP address of the container, for instance). Up to this point, our picture is actually quite simple.

KubernetesVolumesI

Now things get a bit more complicated if you want to mount additional volumes. Kubernetes does in fact offer a large number of different volume types. Some of these volume types are ephemeral, i.e. the data is potentially lost if the pod dies or is rescheduled to a different node, other types of volumes are persistent. In this post, we focus on ephemeral storage and discuss different strategies to attach persistent storage in a later post.

Mount ephemeral storage of type emptyDir

In Kubernetes, we can define volumes on the level of an individual pod and attach these volumes to one or more containers that are running in this pod. Kubernetes offers several types of volumes. The type we are going to look at first is called an emptyDir because, from the point of view of a container, it is exactly that – a directory which is initially empty.

To see this in action, let us look at the following manifest file.

apiVersion: v1
kind: Pod
metadata:
  name: empty-dir-demo
  namespace: default
spec:
  containers:
  - name: empty-dir-demo-ctr
    image: httpd:alpine
    volumeMounts:
      - mountPath: /test
        name: test-volume
  volumes:
  - name: test-volume
    emptyDir: {}

This manifest file defines an individual Pod, as we have seen it before. However, there are a few new elements which are populated in this manifest. The Pod specification contains a new field volumes, which is an array of volume objects. This volume has a name and an additional field which indicates the type of the volume. The documentation lists many of them, here we are working with a volume of type emptyDir.

In the container specification, we now refer to this volume. This instructs Kubernetes to create the volume and to mount it into this container at the defined mount point. To see this in action, let us apply this manifest file, spawn a shell in the pod that is created and inspect its file system.

$ kubectl apply -f https://raw.githubusercontent.com/christianb93/Kubernetes/master/emptyDir.yaml 
pod/empty-dir-demo created
$ kubectl exec -it empty-dir-demo "/bin/bash"
bash-4.4# mount | grep "test"
/dev/xvda1 on /test type xfs (rw,noatime,attr2,inode64,noquota)

So we see that Kubernetes has actually mounted a new file system onto the mount point /test. To figure out how this is realized, let us take a closer look at the Docker container that has been created. So ssh into the node on which the Pod is running and run the following commands (this assumes that jq is installed on the node, which is the default when using the standard AWS AMI).

$ containerId=$(docker ps | grep "httpd" | awk '{print $1}')
$ docker inspect $containerId | jq -r '.[0].Mounts[]'
{
  "Type": "bind",
  "Source": "/var/lib/kubelet/pods/0914a859-4da2-11e9-931c-06a2d10ef1fe/volumes/kubernetes.io~empty-dir/test-volume",
  "Destination": "/test",
  "Mode": "",
  "RW": true,
  "Propagation": "rprivate"
}
[ ... more output ... ]

So we find that Kubernetes realizes an emptyDir volume as a bind mount, i.e. Kubernetes will create a directory on the nodes local file system and use a Docker bind mount to mount this into the container. Of course, this directory will initially be empty (as the name strongly suggests). Let us see what happens if we actually write something onto this file system. The following commands (to be run again on the node on which the Pod is running) extract the directory which is used for the bind mount from the output of docker inspect and list the contents of this directory.

$ dir=$(docker inspect $containerId | jq -r '.[0].Mounts[] | select(.Destination=="/test") | .Source')
$ sudo ls $dir

If you run this now, you will find that the directory is empty. Now switch back to the terminal attached to the Pod and create a file in the /test directory.

bash-4.4# echo "hello" > /test/hello

If you now list the directories content again, you will find that a file hello has been created.

Knowing how an emptyDir is implemented now makes it easy to understand the statements on the lifecycle in the Kubernetes documentation. It is stored in a directory specific for the Pod, i.e. it is initially created when the Pod is created and removed when the Pod is removed. It survices container restarts, but when the Pod is migrated to a different node, the content will be lost. In that sense, it is ephemeral storage.

KubernetesVolumesII

Accessing host-local file systems

We have found that a volume of type emptyDir is nothing but a Docker bind mount to a Pod specific directory managed by Kubernetes. Of course, Kubernetes also offers a way to set up bind mounts to existing directories in the host file system (needless to say that this might be a security risk). This done using a volume of type hostPath as in the example below.

apiVersion: v1
kind: Pod
metadata:
  name: host-path-demo
  namespace: default
spec:
  containers:
  - name: host-path-demo-ctr
    image: httpd:alpine
    volumeMounts:
      - mountPath: /test
        name: test-volume
  volumes:
  - name: test-volume
    hostPath: 
      path: /etc

When you run this and attach to the resulting Pod, you will find that the content of the directory /test now match the content of the directory /etc on the host. Using again docker inspect on the node on which the Pod is running, you will find that Kubernetes has created an additional bind mount for the container which links the containers /test directory to the directory /etc on the host. Consequently, the contents of a hostPath volume will survive container restarts but will not be accessible anymore once the Pod is migrated to a different host.

Watching Kubernetes networking in action

In this post, we will look in some more detail into networking in a Kubernetes cluster. Even though the Kubernetes networking model is independent of the underlying cloud provider, the actual implementation does of course depend on the cloud provider which communicates with Kubernetes through a CNI plugin.

I will continue to use EKS, so some of this will be EKS specific. To work with me through the example, you will first have to bring up your cluster, start two nodes and deploy a pod running a httpd on one of the nodes. I have written a script up.sh and a manifest file that automates all this. To download and apply all this, enter

$ git clone https://github.com/christianb93/Kubernetes.git
$ cd Kubernetes/cluster
$ chmod 700 up.sh
$ ./up.sh
$ kubectl apply -f ../pods/alpine.yaml

Node-to-Pod networking

Now let us log into the node on which the container is running and collect some information on the local network interface attached to the VM.

$ ifconfig eth0
eth0: flags=4163  mtu 9001
        inet 192.168.118.64  netmask 255.255.192.0  broadcast 192.168.127.255
        inet6 fe80::2b:dcff:fee7:448c  prefixlen 64  scopeid 0x20
        ether 02:2b:dc:e7:44:8c  txqueuelen 1000  (Ethernet)
        RX packets 197837  bytes 274587781 (261.8 MiB)
        RX errors 0  dropped 0  overruns 0  frame 0
        TX packets 25656  bytes 2389608 (2.2 MiB)
        TX errors 0  dropped 0 overruns 0  carrier 0  collisions 0

So the local IP address of the node is 192.168.118.64. If we do a kubectl get pods -o wide, we get a different IP address – 192.168.99.199 – for the pod. Let us curl this from the node.

$ curl 192.168.99.199
<h1>It works!</h1>

So apparently we have reached our httpd. To understand why this works, let us investigate the network configuration in more detail. First, on the node on which the container is running, let us take a look at the network configuration inside the container.

$ ID=$(docker ps --filter name=alpine-ctr --format "{{.ID}}")
$ docker exec -it $ID "/bin/bash"
bash-4.4# ip link
1: lo:  mtu 65536 qdisc noqueue state UNKNOWN qlen 1000
    link/loopback 00:00:00:00:00:00 brd 00:00:00:00:00:00
3: eth0@if6:  mtu 9001 qdisc noqueue state UP 
    link/ether 4a:8b:c9:bb:8c:8e brd ff:ff:ff:ff:ff:ff
bash-4.4# ifconfig eth0
eth0      Link encap:Ethernet  HWaddr 4A:8B:C9:BB:8C:8E  
          inet addr:192.168.99.199  Bcast:192.168.99.199  Mask:255.255.255.255
          UP BROADCAST RUNNING MULTICAST  MTU:9001  Metric:1
          RX packets:12 errors:0 dropped:0 overruns:0 frame:0
          TX packets:0 errors:0 dropped:0 overruns:0 carrier:0
          collisions:0 txqueuelen:0 
          RX bytes:936 (936.0 B)  TX bytes:0 (0.0 B)
bash-4.4# ip route
default via 169.254.1.1 dev eth0 
169.254.1.1 dev eth0 scope link

What do we learn from this? First, we see that inside the container namespace, there is a virtual ethernet device eth0, with IP address 192.168.99.199. If you run kubectl get pods -o wide on your local workstation, you will find that this is the IP address of the Pod. We also see that there is a route in the container namespace that direct all traffic to this interface. The output of the ip link command also shows that this device is a virtual ethernet device that has a paired device (with index if6) in a different namespace. So let us exit the container, go back to the node and try to figure out what the network configuration on the node is.

$ ip link
1: lo:  mtu 65536 qdisc noqueue state UNKNOWN mode DEFAULT group default qlen 1000
    link/loopback 00:00:00:00:00:00 brd 00:00:00:00:00:00
2: eth0:  mtu 9001 qdisc pfifo_fast state UP mode DEFAULT group default qlen 1000
    link/ether 02:2b:dc:e7:44:8c brd ff:ff:ff:ff:ff:ff
3: eni3f5399ec799:  mtu 9001 qdisc noqueue state UP mode DEFAULT group default 
    link/ether 66:37:e5:82:b1:f6 brd ff:ff:ff:ff:ff:ff link-netnsid 0
4: enie68014839ee@if3:  mtu 9001 qdisc noqueue state UP mode DEFAULT group default 
    link/ether f6:4f:62:dc:38:18 brd ff:ff:ff:ff:ff:ff link-netnsid 1
5: eth1:  mtu 9001 qdisc pfifo_fast state UP mode DEFAULT group default qlen 1000
    link/ether 02:e8:f0:26:a7:3e brd ff:ff:ff:ff:ff:ff
6: eni97d5e6c4397@if3:  mtu 9001 qdisc noqueue state UP mode DEFAULT group default 
    link/ether b2:c9:58:c0:20:25 brd ff:ff:ff:ff:ff:ff link-netnsid 2
$ ifconfig eth0
eth0: flags=4163  mtu 9001
        inet 192.168.118.64  netmask 255.255.192.0  broadcast 192.168.127.255
        inet6 fe80::2b:dcff:fee7:448c  prefixlen 64  scopeid 0x20
        ether 02:2b:dc:e7:44:8c  txqueuelen 1000  (Ethernet)
        RX packets 197837  bytes 274587781 (261.8 MiB)
        RX errors 0  dropped 0  overruns 0  frame 0
        TX packets 25656  bytes 2389608 (2.2 MiB)
        TX errors 0  dropped 0 overruns 0  carrier 0  collisions 0
$ ip route
default via 192.168.64.1 dev eth0 
169.254.169.254 dev eth0 
192.168.64.0/18 dev eth0 proto kernel scope link src 192.168.118.64 
192.168.89.17 dev eni3f5399ec799 scope link 
192.168.99.199 dev eni97d5e6c4397 scope link 
192.168.109.216 dev enie68014839ee scope link

Here we see that – in addition to a few other interfaces – there is a device eth0 to which all traffic is sent by default. However, there is also a device eni97d5e6c4397 which is the other end of the interface visible in the container. And there is a route that sends all traffic that is directed to the IP address of the pod to this interface. Overall, this gives a picture which seems familiar from our earlier analysis of docker networking

KubernetesNetworkingOne

If we try to establish a connection to the httpd running in the pod, the routing table entry on the node will send the traffic to the interface eni97d5e6c4397. This is one end of a veth-pair, the other end appears inside the container as eth0. So from the containers point of view, this is incoming traffic received via eth0, which is happily accepted and processed by the httpd. The reply goes the other way – it is directed to eth0 inside the container, travels via the veth pair and ends up inside the host namespace, coming from eni97d5e6c4397.

Pod-to-Pod networking across nodes

Now let us try something else. Log into the second node – on which the container is not running – and try the curl from there. Surprisingly, this works as well! What we have seen so far does not explain this, so there is probably a piece of magic that we are still missing. To find this, let us use the aws cli to print out the network interfaces attached to the node on which the container is running (the following snippet assumes that you have the extremely helpful tool jq installed on your PC).

$ nodeName=$(kubectl get pods --output json | jq -r ".items[0].spec.nodeName")
$ aws ec2 describe-instances --output json --filters Name=private-dns-name,Values=$nodeName --query "Reservations[0].Instances[0].NetworkInterfaces"
---- SNIP -----
{
        "MacAddress": "02:e8:f0:26:a7:3e",
        "SubnetId": "subnet-06088e09ce07546b9",
        "PrivateDnsName": "ip-192-168-84-108.eu-central-1.compute.internal",
        "VpcId": "vpc-060469b2a294de8bd",
        "Status": "in-use",
        "Ipv6Addresses": [],
        "PrivateIpAddress": "192.168.84.108",
        "Groups": [
            {
                "GroupName": "eks-auto-scaling-group-myCluster-NodeSecurityGroup-1JMH4SX5VRWYS",
                "GroupId": "sg-08163e3b40afba712"
            }
        ],
        "NetworkInterfaceId": "eni-0ed2f1cf4b09cb8be",
        "OwnerId": "979256113747",
        "PrivateIpAddresses": [
            {
                "Primary": true,
                "PrivateDnsName": "ip-192-168-84-108.eu-central-1.compute.internal",
                "PrivateIpAddress": "192.168.84.108"
            },
            {
                "Primary": false,
                "PrivateDnsName": "ip-192-168-72-200.eu-central-1.compute.internal",
                "PrivateIpAddress": "192.168.72.200"
            },
            {
                "Primary": false,
                "PrivateDnsName": "ip-192-168-96-163.eu-central-1.compute.internal",
                "PrivateIpAddress": "192.168.96.163"
            },
            {
                "Primary": false,
                "PrivateDnsName": "ip-192-168-99-199.eu-central-1.compute.internal",
                "PrivateIpAddress": "192.168.99.199"
            }
        ],
---- SNIP ----

I have removed some of the output to keep it readable. We see that AWS has attached several elastic network interfaces (ENI) to our node. An ENI is a virtual network interface that AWS creates and manages for you. Each node can have more than one ENI attached, and each ENI can have a primary and multiple secondary IP addresses.

If you look at the last line of the output, you see that there is a network interface eni-0ed2f1cf4b09cb8be that has, as one of the secondary IP addresses, the IP address 192.168.99.199. This is the IP address of our Pod! Let us now go back to the node and inspect its network configuration once more. You will not find a network interface with this exact name, but you will find a network interface on the node on which the pod is running which has the same MAC address, namely eth1.

$ ifconfig eth1
eth1: flags=4163  mtu 9001
        inet6 fe80::e8:f0ff:fe26:a73e  prefixlen 64  scopeid 0x20
        ether 02:e8:f0:26:a7:3e  txqueuelen 1000  (Ethernet)
        RX packets 224  bytes 6970 (6.8 KiB)
        RX errors 0  dropped 0  overruns 0  frame 0
        TX packets 20  bytes 1730 (1.6 KiB)
        TX errors 0  dropped 0 overruns 0  carrier 0  collisions 0

This is an ordinary VPC interface and visible in the entire VPC under all of its IP addresses. So if we curl our httpd from the second node, the traffic will leave that node via the default interface, be picked up by the VPC, routed to the node on which the pod is running and enter via eth1. As IP forwarding is enabled on this node, the traffic will be routed to the Pod and arrive at the httpd.

This is the missing piece of magic we have been looking for. In fact, for every pod running on a node, EKS will add an additional secondary IP address to an ENI attached to the node (and attach additional ENIs if needed) which will make the Pod IP addressses visible in the entire VPC. This mechanism is nicely described in the documentation of the CNI plugin which EKS uses. So we now have the following picture.

KubernetesNetworkingTwo

So this allows us to run our httpd in such a way that it can be reached from the entire Pod network (and the entire VPC). Note, however, that it can of course not be reached from the outside world. It is interesting to repeat this experiment with a slighly adapted YAML file that uses the containerPort field:

apiVersion: v1
kind: Pod
metadata:
  name: alpine
  namespace: default
spec:
  containers:
  - name: alpine-ctr
    image: httpd:alpine
    ports: 
      - containerPort: 80

If we remove the old Pod and use this YAML file to create a new pod, we will find that the configuration does not change at all. In particular, running docker ps on the node on which the Pod is scheduled will teach you that this port specification is not the equivalent of the port specification of the docker run port mapping feature – as the Kubernetes API specification states, this field is informational.

Implementation of services

Let us now see how this picture changes if we add a service. First, we will use a service of type ClusterIP, i.e. a service that will make our httpd reachable from within the entire cluster under a common IP address. For that purpose – after deleting our existing pods – let us create a deployment that brings up two instances of the httpd.

$ kubectl apply -f https://raw.githubusercontent.com/christianb93/Kubernetes/master/pods/deployment.yaml

Once the pods are up, you can again use curl to verify that you can talk to every pod from every node and every pod. Now let us create a service.

$ kubectl apply -f https://raw.githubusercontent.com/christianb93/Kubernetes/master/network/service.yaml

Once that has been done, enter kubectl get svc to get a list all services. You should see a newly created service alpine-service. Note down its cluster IP address – in my case this was 10.100.11.202.

Now log into one of the nodes again, attach to the container, install curl there and try to connect to port 10.100.11.202:8080

$ ID=$(docker ps --filter name=alpine-ctr --format "{{.ID}}")
$ docker exec -it $ID "/bin/bash"
bash-4.4# apk add curl
OK: 124 MiB in 67 packages
bash-4.4# curl 10.100.11.202:8080
<h1>It works!</h1>

So, as promised by the definition of s service, the httpd is visible within the cluster under the cluster IP address of the service. The same works if we are on a node and not attached to a container.

To see how this works, let us log out of the container again and search the NAT tables for the cluster IP address of the service.

$ sudo iptables -S -t nat | grep 10.100.11.202
-A KUBE-SERVICES -d 10.100.11.202/32 -p tcp -m comment --comment "default/alpine-service: cluster IP" -m tcp --dport 8080 -j KUBE-SVC-SXWLG3AINIW24QJC

So we see that Kubernetes (more precisely the kube-proxy running on each node) has added a NAT rule that captures traffic directed towards the service IP address to a special chain. Let us dump this chain.

$ sudo iptables -S -t nat | grep KUBE-SVC-SXWLG3AINIW24QJC
-N KUBE-SVC-SXWLG3AINIW24QJC
-A KUBE-SERVICES -d 10.100.11.202/32 -p tcp -m comment --comment "default/alpine-service: cluster IP" -m tcp --dport 8080 -j KUBE-SVC-SXWLG3AINIW24QJC
-A KUBE-SVC-SXWLG3AINIW24QJC -m comment --comment "default/alpine-service:" -m statistic --mode random --probability 0.50000000000 -j KUBE-SEP-YRELRNVKKL7AIZL7
-A KUBE-SVC-SXWLG3AINIW24QJC -m comment --comment "default/alpine-service:" -j KUBE-SEP-BSEIKPIPEEZDAU6E

Now this is actually pretty interesting. The first line is simply the creation of the chain. The second line is the line that we already looked at above. The next two lines are the lines we are looking for. We see that, with a probability of 50%, we either jump to the chain KUBE-SEP-YRELRNVKKL7AIZL7 or to the chain KUBE-SEP-BSEIKPIPEEZDAU6E. Let us display one of them.

$ sudo iptables -S KUBE-SEP-BSEIKPIPEEZDAU6E -t nat 
-N KUBE-SEP-BSEIKPIPEEZDAU6E
-A KUBE-SEP-BSEIKPIPEEZDAU6E -s 192.168.191.152/32 -m comment --comment "default/alpine-service:" -j KUBE-MARK-MASQ
-A KUBE-SEP-BSEIKPIPEEZDAU6E -p tcp -m comment --comment "default/alpine-service:" -m tcp -j DNAT --to-destination 192.168.191.152:80

So we see the that this chain has two rules. The first rule marks all packages that are originating from the pod running on this node, this mark is later evaluated in the forwarding rules to make sure that the packet is accepted for forwarding. The second rule is where the magic happens – it performs a DNAT, i.e. a destination NAT, and sends our packets to one of the pods. The rule KUBE-SEP-YRELRNVKKL7AIZL7 is similar, with the only difference that it sends the packets to the other pod. So we see that two things are happening

  • Traffic directed towards port 8080 of the cluster IP address is diverted to one of the pods
  • Which one of the pods is selected is determined randomly, with a probability of 50% for both pods. Thus these rules implement a simple load balancer.

Let us now see how things change when we use a service of type NodePort. So let us use a slightly different YAML file.

$ kubectl delete -f https://raw.githubusercontent.com/christianb93/Kubernetes/master/network/service.yaml
$ kubectl apply -f https://raw.githubusercontent.com/christianb93/Kubernetes/master/network/nodePortService.yaml

When we now run kubectl get svc, we see that our service appears as a NodePort service, and, as the second entry in the columns PORTS, we find the port that Kubernetes opens for us.

$ kubectl get services
NAME             TYPE        CLUSTER-IP     EXTERNAL-IP   PORT(S)          AGE
alpine-service   NodePort    10.100.165.3           8080:32755/TCP   13s
kubernetes       ClusterIP   10.100.0.1             443/TCP          7h

In my case, the port 32755 has been used. If we now go back to one of the nodes and search the iptables rules for this port, we find that Kubernetes has created two additional NAT rules.

$ sudo iptables -S  -t nat | grep 32755
-A KUBE-NODEPORTS -p tcp -m comment --comment "default/alpine-service:" -m tcp --dport 32755 -j KUBE-MARK-MASQ
-A KUBE-NODEPORTS -p tcp -m comment --comment "default/alpine-service:" -m tcp --dport 32755 -j KUBE-SVC-SXWLG3AINIW24QJC

So we find that for all traffic directed to this port, again a marker is set and the rule KUBE-SVC-SXWLG3AINIW24QJC applies. If you inspect this rule, you will find that it is similar to the rules above and again realizes a load balancer that sends traffic to port 80 of one of the pods.

Let us now verify that we can really reach this pod from the outside world. Of course, this only works once we have allowed incoming traffic on at least one of the nodes in the respective AWS security group. The following commands determine the node Port, your IP address, the security group and the IP address of the node, allow access and submit the curl command (note that I use the cluster name myCluster to select the worker nodes, in case you are not using my scripts to run this example, you will have to change the filter to make this work).

$ nodePort=$(kubectl get svc alpine-service --output json | jq ".spec.ports[0].nodePort")
$ IP=$(aws ec2 describe-instances --filters Name=tag-key,Values=kubernetes.io/cluster/myCluster Name=instance-state-name,Values=running --output text --query Reservations[0].Instances[0].PublicIpAddress)
$ SEC_GROUP_ID=$(aws ec2 describe-instances --filters Name=tag-key,Values=kubernetes.io/cluster/myCluster Name=instance-state-name,Values=running --output text --query Reservations[0].Instances[0].SecurityGroups[0].GroupId)
$ myIP=$(wget -q -O- https://ipecho.net/plain)
$ aws ec2 authorize-security-group-ingress --group-id $SEC_GROUP_ID --port $nodePort --protocol tcp --cidr "$myIP/32"
$ curl $IP:$nodePort
<h1>It works!</h1>

Summary

After all these nitty-gritty details, let us summarize what we have found. When you start a pod on a node, a pair of virtual ethernet devices is created, with one end being assigned to the namespace of the container and one end being assigned to the namespace of the host. Then IP routes are added so that traffic directed towards the pod is forwarded to this bridge. This allows access to the container from the node on which they are running. To realize access from other nodes and pods and thus the flat Kubernetes networking model, EKS uses the AWS CNI plugin which attaches the pods IP addresses as secondary IP addresses to elastic network interfaces.

When you start a service, Kubernetes will in addition set up NAT rules that will capture traffic determined for the cluster IP address of the service and perform a destination network address translation so that this traffic gets send to one of the pods. The pod is selected at random, which implements a simple load balancer. For a service of type NodePort, additional rules will be created which make sure that the same NAT processing applies to traffic coming from the outside world.

This completes today post. If you want to learn more, you might want to check out some of the links below.

Kubernetes – an overview

Docker containers are nice and offer a very lean and structured way to package and deploy applications. However, if you really want to run large scale containerized applications, you need more – you need to deploy, orchestrate and manager all your containers in a highly customizable and automated way. In other words, you need a container management platform like Kubernetes.

What is a container management platform?

Imagine you have a nice, modern application based on microservices, and you have decided to deploy each microservice into a separate container. Thus your entire application deployment will consist of a relatively large number, maybe more than hundred, individual containers. Each of these containers needs to be deployed, configured and monitored. You need to make sure that if a container goes down, it is restarted and traffic is diverted to a second instance. You need to distribute your load evenly. You need to figure out which container should run on which virtual or physical machine. When you upgrade or deploy, you need to take dependencies into account. If traffic reaches a certain threshold, you would like to scale, either vertically or horizontally. And so forth…

Thus managing a large number of containers in a production-grade environment requires quite some effort. It would be nice to have a platform that is able to

  • Offer loadbalancing, so that incoming traffic is automatically routed to several instances of a service
  • Easily set up container-level networks
  • Scale out automatically if load increases
  • Monitor running services and restart them if needed
  • Distribute containers evenly across all nodes in your network
  • Spin up new nodes or shut down nodes depending on the traffic
  • Manage your volumes and storage
  • Offer mechanisms to upgrade your application and the platform and / or rollback upgrades

In other words, you need a container management platform. In this post – and in a few following posts – I will focus on Kubernetes, which is emerging as a de facto standard for container management platforms. Kubernetes is now the underlying platform for industry grade products like RedHat OpenShift or Rancher, but can of course be used stand-alone as well. In addition, all major cloud providers like Amazon (EKS), Google (GKE), Azure (AKS) and IBM ( IBM Cloud Kubernetes Service) offer Kubernetes as a service on their respective platforms.

Basic Kubernetes concepts

When you first get in touch with the world of Kubernetes, the terminology can be a bit daunting – there are pods, clusters, services, containers, namespaces, deployments, and many other terms that will be thrown at you. Time to explain some of the basic concepts very high level – we will get in closer contact with most of them over the next few posts.

The first object we need to understand is a Kubernetes node. Essentially, a node is a compute ressource, i.e. some sort of physical or virtual host on which Kubernetes can run things. In a Kubernetes cluster, there are two types of nodes. A master node is a node on which the Kubernetes components itself are running. A worker node is a node on which application workloads are running.

On each worker node, Kubernetes will start several agents, for instance the kubelet which is the primary agent responsible for controlling a node. In addition to the agent, there are of course the application workloads. One might suspect that these workloads are managed on a container basis, however, this is not quite the case. Instead, Kubernetes groups containers into objects called pods. A pod is the smallest unit handled by Kubernetes. It encompasses one or more containers that share resources like storage volumes, network namespaces and the same lifecycle. It is quite common to see pods with only one application container, but one might also decide to put, for instance, a microservice and a database into one pod. In this case, when the pod is started, both containers (the container containing the microservice and the container containing the database) are brought up on the same node, can see each other in the network under “localhost” and can access the same volumes. In a certain sense, a pod is therefore a sort of logical host on which our application containers run. Kubernets assigns IP addresses to pods, and applications running in different pods need to use these IP addresses to communicate via the network.

When a user asks Kubernetes to run a pod, a Kubernetes component called the scheduler identifies a node on which the pod is then brought up. If the pod dies and needs to be restarted, it might be that the pod is restarted on a different node. The same applies if the node goes down, in this case Kubernetes will restart pods running on this container on a different node. There are also other situations in which a pod can be migrated from one node to a different node, for instance for the purpose of scaling. Thus, a pod is a volatile entity, and an application needs to be prepared for this.

KubernetesBasics

Pods themselves are relatively dumb objects. A large part of the logic to handle pods is located in componentes called controllers. As the name suggests, these are components that control and manage pods. There are, for instance, special controllers that are able to autoscale the number of pods or to run a certain number of instances of the same pod – called replicas. In general, pods are not started directly by a Kubernetes user, but controllers are defined that manage the pods life cycle.

In Kubernetes, a volume is also defined in the context of a pod. When the pod ceases to exist, so does the volume. However, a volume can of course be backed by persistent storage, in which case the data on the volume will outlive the pod. On AWS, we could for instance mount an EBS volume as a Kubernetes volume, in which case the data will persist even if we delete the pod, or we could use local storage, in which case the data will be lost when either the pod or the host on which the pod is running (an AWS virtual machine) is terminated.

There are many other objects that are important in Kubernetes that we have not yet discussed – networks, services, policies, secrets and so forth. This post is the first in a series which will cover most of these topics in detail. My current plans are to discuss

Thus, in the next post, we will learn how to set up and configure AWS EKS to see some pods in action (I will start with EKS for the time being, but also cover other platforms like DigitalOcean later on).

Controlling Docker container with Python

In the last few posts on the bitcoin blockchain, I have already extensively used Docker container to quickly set up test environments. However, it turned out to be a bit tiresome to run the containers, attach to them, execute commands etc. to get into a defined state. Time to learn how this can be automated easily using our beloved Python – thanks to the wonderful Docker Python SDK.

This package uses the Docker REST API and offers an intuitive object model to represent container, images, networks and so on. The API can be made available via a TCP port in the Docker configuration, but be very careful if you do this – everybody who has access to that port will have full control over your Docker engine. Fortunately, the Python package can also connect via the standard Unix domain socker on the file system which is not exposed to the outside world.

As always, you need to install the package first using

$ pip install docker

Let us now go through some objects and methods in the API one by one. At the end of the post, I will show how you a complete Python notebook that orchestrates the bitcoind container that we have used in our tests in the bitcoin series.

The first object we have to discuss is the client. Essentially, a client encapsulates a connection to the Docker engine. Creating a client with the default configuration is very easy.

import docker
client = docker.client.from_env()

The client object has only very few methods like client.info() or client.version() that return global status information. The more interesting part of this object are the collections attached to it. Let us start with images, which can be accessed via client.images. To retrieve a specific instance, we can use client.images.list(), passing as an argument a name or a filter. For instance, when we know that there is exactly one image called “alice:latest”, we can get a reference to it as follows.

alice = client.images.list("alice:latest")[0]

Other commands, like pull or push, are the equivalents of the corresponding docker CLI commands.

Let us now turn to the client.containers collection. Maybe the most important method that this collection offers is the run method. For instance, to run a container and capture its output, use

output = client.containers.run("alpine", "ls", auto_remove=True)

This will run a container based on the alpine image and pass “ls” as an argument (which will effectively execute ls as alpine container will run a shell for you) and return the output as a sequence of bytes. The container will be removed after execution is complete.

By setting detach=True, the container will run in detached mode and the call will return immediately. In this case, the returned object is not the output, but a reference to the created container which you can use later to work with the container. If, for instance, you wanted to start an instance of the alice container, you could do that using

alice = client.containers.run("alice:latest", auto_remove=True, detach=True)

You could then use the returned handle to inspect the logs (alice.logs()), to commit, to exec code in the container similar to the docker exec command (alice.exec_run) and so forth.

To demonstrate the possibilities that you have, let us look at an example. The following notebook will start two instances (alice, bob) of the bitcoin-alpine image that you hopefully have build when you have followed my series on bitcoin. It then uses the collection client.networks to figure out to which IP address on the bridge network bob is connected. Then, we attach to the alice container and run bitcoin-cli in this container to instruct the bitcoind to connect to the instance running in container bob.

We then use the bitcoin-cli running inside the container alice to move the blockchain into a defined state – we mine a few blocks, import a known private key into the wallet, transfer a certain amount to a defined address and mine a few additional blocks to confirm the transfer. Here is the notebook.

Sorry, something went wrong. Reload?
Sorry, we cannot display this file.
Sorry, this file is invalid so it cannot be displayed.

Make sure to stop all containers again when you are done, it is comparatively easy to produce a large number of stopped containers if you are not careful and use this for automated tests. I usually run the container with the --rm flag on the command line or the auto_remove=True flag in Python to make sure that they are removed by the Docker engine automatically when they stop.

Of course nobody would use this to simply run a few docker containers with a defined network setup, there are much better tools like Docker Swarm or other container management solutions for this. However, the advantage of using the Python SDK is that we can interact with the containers, run commands, perform tests etc. And all this can be integrated nicely into integration tests using test fixtures, for instance those provided by pytest. A fixture could bring up the environment, could be defined on module level or test level depending on the context, and can add a finalizer to shut down the environment again after the test has been executed. This allows for a very flexible test setup and offers a wide range of options for automated testing.

This post could only give a very brief introduction into the Python Docker SDK and we will not at all discuss pytest and fixtures – but I invite you to browse the Docker SDK documentation and pytest fixtures and hope you enjoy to play with this!

Docker internals: networking part II

In this post, we will look in more detail at networking with Docker if communication between a Docker container and either the host or the outside world is involved.

It turns out that in these cases, the Linux Netfilter/iptables facility comes into play. This post is not meant to be an introduction into iptables, and I will assume that the reader is aware of the basics (for more information, I found the tutorial on frozentux and the overview on digitalozean very helpful).

Setup and basics

To simplify the setup, we will only use one container in this post. So let us again designate a terminal to be the container terminal and in this terminal, enter

$ docker run --rm -d --name "container1" httpd:alpine
$ docker exec -it container1 "/bin/sh"

You should now see a shell prompt inside the container. When you run netstat -a from that prompt, you should see a listening socket being bound to port 80 within the container.

Now let us print out the iptables configuration on the host system.

$ sudo iptables -S
-P INPUT ACCEPT
-P FORWARD DROP
-P OUTPUT ACCEPT
-N DOCKER
-N DOCKER-ISOLATION
-N DOCKER-USER
-A FORWARD -j DOCKER-USER
-A FORWARD -j DOCKER-ISOLATION
-A FORWARD -o docker0 -m conntrack --ctstate RELATED,ESTABLISHED -j ACCEPT
-A FORWARD -o docker0 -j DOCKER
-A FORWARD -i docker0 ! -o docker0 -j ACCEPT
-A FORWARD -i docker0 -o docker0 -j ACCEPT
-A DOCKER-ISOLATION -j RETURN
-A DOCKER-USER -j RETURN

Here we see that Docker has added three new chains and a couple of rules. The first chain that Docker has added is the DOCKER chain. In our configuration, that chain is empty, we will see later that this will change once we expose ports to the outside world.

The second chain that we see is the DOCKER-ISOLATION chain. I have not been able to find out much about this chain so far, but it appears that Docker uses this chain to add rules that isolate containers when you do not use the default bridge device but connect your containers to user defined bridges.

Finally, there is the chain DOCKER-USER that Docker adds, but otherwise leaves alone, so that firewall rules can be added by an administrator with a bit less conflict of clashing with the manipulations that Docker performs.

All these chains are empty or just consist of a RETURN statement, so we can safely ignore them for the time being.

Host-to-container traffic

As a first use case, let us now try to understand what happens when an application (curl in our case) in the host namespace wants to talk to the web server running in our container. To be able to better see what is going on, let us add two logging rules to the iptables configuration to log traffic coming in via the docker0 bridge and going out via the docker0 bridge.

$ sudo iptables -A INPUT -i docker0 -j LOG --log-prefix "IN: " --log-level 3
$ sudo iptables -A OUTPUT -o docker0 -j LOG --log-prefix "OUT: " --log-level 3

With these rules in place, let us now create some traffic. In the host terminal, enter

$ curl 172.17.0.2

We can now inspect the content of /var/log/syslog to see what happened. The first two entries should like like this (stripping of host name and time stamps):

OUT: IN= OUT=docker0 SRC=172.17.0.1 DST=172.17.0.2 LEN=60 TOS=0x00 PREC=0x00 TTL=64 ID=3460 DF PROTO=TCP SPT=34322 DPT=80 WINDOW=29200 RES=0x00 SYN URGP=0 
IN: IN=docker0 OUT= PHYSIN=veth376d25c MAC=02:42:25:b7:e5:38:02:42:ac:11:00:02:08:00 SRC=172.17.0.2 DST=172.17.0.1 LEN=60 TOS=0x00 PREC=0x00 TTL=64 ID=0 DF PROTO=TCP SPT=80 DPT=34322 WINDOW=28960 RES=0x00 ACK SYN URGP=0 

So we see that the first logging rule that has been triggered is the rule in the OUTPUT chain. Let us try to understand in detail how this log entry was created.

When curl asks the kernel to establish a connection with 17.17.0.2, i.e. to send a TCP SYN request, a TCP packet will be generated and handed over to the kernel. The kernel will consult its routing table, find the route via docker0 and send the packet to the bridge device.

At this point, the packet leaves the namespace for which this set of iptables rules is responsible, so the OUTPUT chain is traversed and our log entry is created.

What happens next? The packet is picked up by the container namespace, processed and the answer goes back. We can see the answer coming in again, this time triggering the logging in the INPUT rule – this is the second line, the SYN ACK packet.

Except our logging rule, no other rules are defined in the INPUT and OUTPUT chains, so the default policies apply for our packets. As both policies are set to ACCEPT, netfilter will allow our packets to pass and the connection works.

Getting out of the container

The story is a bit different if we are trying to talk to a web server on the host or on the LAN from within the container. Thus, from the kernels point of view, we are now dealing with traffic involving more than one interface, and in addition to the INPUT and OUTPUT chains, the FORWARD chain becomes relevant. To be able to inspect this traffic, let us therefore add two logging rules to the FORWARD chain.

$ sudo iptables -I FORWARD -i docker0 -j LOG --log-prefix "IN_FORWARD: " --log-level 3
$ sudo iptables -I FORWARD -o docker0 -j LOG --log-prefix "OUT_FORWARD: " --log-level 3

Now let us generate some traffic. The first thing that I have tried is to reach my SAN on the same network which is a Synology diskstation listening on port 5000 of 192.168.178.28. So in the container window, I did a

# telnet 192.168.178.28:5000

and entered some nonsens (it does not matter so much what you enter here, it will most likely result in a “bad request” message, but it generates traffic – do not forget to hit return). This will again produce some logging output, the first two lines being

IN_FORWARD: IN=docker0 OUT=enp4s0 PHYSIN=veth376d25c MAC=02:42:25:b7:e5:38:02:42:ac:11:00:02:08:00 SRC=172.17.0.2 DST=192.168.178.28 LEN=60 TOS=0x00 PREC=0x00 TTL=63 ID=28280 DF PROTO=TCP SPT=54062 DPT=5000 WINDOW=29200 RES=0x00 SYN URGP=0 
OUT_FORWARD: IN=enp4s0 OUT=docker0 MAC=1c:6f:65:c0:c9:85:00:11:32:77:fe:46:08:00 SRC=192.168.178.28 DST=172.17.0.2 LEN=60 TOS=0x00 PREC=0x00 TTL=63 ID=0 DF PROTO=TCP SPT=5000 DPT=54062 WINDOW=14480 RES=0x00 ACK SYN URGP=0

Let us again try to understand what happened. An application (telnet in our case) wants to reach the IP address 192.168.178.28. The kernel will first consult the routing table in the namespace of the container and decide to use the default route via the eth0 device. Thus the packet will go to the bridge device docker0. There, it will be picked up by the netfilter chain in the host namespace. As the destination address is not one of the IP addresses of the host, it will be handled by the FORWARD chain, which will trigger our logging rules.

Let us now inspect the other rules in the forward chain once more using iptables -S FORWARD. We see that in addition to the rules pointing to the docker generated subchains and in addition to our own logging rules, there are two rules relevant for our case.

$ sudo iptables  -S  FORWARD
-A FORWARD -o docker0 -m conntrack --ctstate RELATED,ESTABLISHED -j ACCEPT
-A FORWARD -i docker0 ! -o docker0 -j ACCEPT

The first rule will accept all traffic that comes in at any network device and is routed towards the bridge device if that traffic belongs to an already established connection. This allows the answer to our TCP request to travel back from the network interface connected to the local network (enp4s0 in my case) to the container. However, unsolicited requests, i.e. new connection requests targeted towards the bridge device will be left to the default policy of the FORWARD chain and therefore dropped.

The second rule will allow outgoing traffic – all packets coming from the docker0 bridge device targeted towards any other interface will be accepted and hence forwarded. As there is no filter on the connection state, this allows an application inside the container to establish a new connection to the outside world.

However, I have been cheating a bit and skipped one important point. Suppose our SYN request happily leaves our local network adapter and travels through the LAN. The request comes from within the container, so from the IP address 172.17.0.2. If that IP address would still appear in the IP header, the external server (the disk station in my case) would try to send the answer back to this address. However, this address is not known in the LAN, only locally on my machine, and the response would get lost.

To avoid this, Docker will in fact add one more rule to the NAT table. Let us try to locate this rule.

$ sudo iptables  -S -t nat 
-P PREROUTING ACCEPT
-P INPUT ACCEPT
-P OUTPUT ACCEPT
-P POSTROUTING ACCEPT
-N DOCKER
-A PREROUTING -m addrtype --dst-type LOCAL -j DOCKER
-A OUTPUT ! -d 127.0.0.0/8 -m addrtype --dst-type LOCAL -j DOCKER
-A POSTROUTING -s 172.17.0.0/16 ! -o docker0 -j MASQUERADE
-A DOCKER -i docker0 -j RETURN

Again, we see that docker is adding a new chain and some rules pointing to this chain. In addition, there is a rule being added to the POSTROUTING chain which is invoked immediately before a packet leaves the host. This is a so called masquerading rule which will replace the source IP address in the IP header of the outgoing packet by the IP address of the device through which the packet is sent. Thus, from the point of view of my brave diskstation, the packet will look as if it originated from the host and will therefore be sent back to the host. When the response comes in, netfilter will revert the process and forward the packet to the correct destination, in our case the bridge device.

Reaching a server from the outside world

This was already fairly complicated, but now let us try to see what happens if we want to connect to the web server running in our container from the outside world.

Now if I simply ssh into my diskstation and run curl there to reach 172.17.0.2, this will of course fail. The diskstation does not have a route to that destination, and the default gateway cannot help either as this is a private class B network. If I replace the IP address with the IP address of the host, it will not work either – in this case, the request reaches the host, but on the host network address, no process is listening in port 80. So we somehow need to map the port from the container into the host networking system.

If you consult the docker documentation on this case, you will learn that in order to do this, you have to run the container with the -p switch. So let us stop and restart our container and apply that option.

$ docker stop container1
$ docker run --rm -d --name "container1" -p 80:80 httpd:alpine
$ docker exec -it container1 "/bin/sh"

If we now inspect the chains and see what has changed, we can find the following new rule which has been added to the filter table.

A DOCKER -d 172.17.0.2/32 ! -i docker0 -o docker0 -p tcp -m tcp --dport 80 -j ACCEPT

This rule will apply to all incoming traffic that is targeted towards 172.17.0.2:80 and not coming from the bridge device, and accept it. In addition, two new rules have been added to the NAT table.

-A POSTROUTING -s 172.17.0.2/32 -d 172.17.0.2/32 -p tcp -m tcp --dport 80 -j MASQUERADE
-A DOCKER ! -i docker0 -p tcp -m tcp --dport 80 -j DNAT --to-destination 172.17.0.2:80

The first rule will again apply a network address translation (SNAT, i.e. manipulating the source address) as we have already seen it before and applies to traffic within the virtual network to which the bridge belongs. The second rule is more interesting. This rule has been added to the DOCKER chain and requests DNAT (i.e. destination NAT, meaning that the target address is replaced) for all packets that are not coming from the bridge device, but have destination port 80. For these packets, the target address is rewritten to be 172.17.0.2:80, so all traffic directed towards port 80 is now forwarded to the container network.

Let us again go through one example step by step. For that purpose, it is useful to add some more logging rules, this time to the NAT table.

$ sudo iptables -t nat -I PREROUTING  -j LOG --log-prefix "PREROUTING: " --log-level 3
$ sudo iptables -t nat -I POSTROUTING  -j LOG --log-prefix "POSTROUTING: " --log-level 3

When we now submit a request from another machine on the local network directed towards 192.168.178.27:80 (i.e. towards the IP address of the host!), we find the following log entries in /var/syslog.

PREROUTING: IN=enp4s0 OUT= MAC=1c:6f:65:c0:c9:85:00:11:32:77:fe:46:08:00 SRC=192.168.178.28 DST=192.168.178.27 LEN=60 TOS=0x00 PREC=0x00 TTL=64 ID=57720 DF PROTO=TCP SPT=54075 DPT=80 WINDOW=14600 RES=0x00 SYN URGP=0 
OUT_FORWARD: IN=enp4s0 OUT=docker0 MAC=1c:6f:65:c0:c9:85:00:11:32:77:fe:46:08:00 SRC=192.168.178.28 DST=172.17.0.2 LEN=60 TOS=0x00 PREC=0x00 TTL=63 ID=57720 DF PROTO=TCP SPT=54075 DPT=80 WINDOW=14600 RES=0x00 SYN URGP=0 
POSTROUTING: IN= OUT=docker0 SRC=192.168.178.28 DST=172.17.0.2 LEN=60 TOS=0x00 PREC=0x00 TTL=63 ID=57720 DF PROTO=TCP SPT=54075 DPT=80 WINDOW=14600 RES=0x00 SYN URGP=0

Thus the first packet of the connection arrives (note that NAT rules are not evaluated for subsequent packets of a connection any more) and will first be processed by the PREROUTING chain of the NAT table. As we added our logging rule here, we see the log output. We can also see that at this point, the target address is still 192.168.178.27:80.

The next rule – still in the PREROUTING chain – that is being evaluated is the jump to the DOCKER chain. Here, the DNAT rule kicks in and changes the destination address to 172.17.0.2, the IP address of the container.

Then the kernel routing decision is taken based on the new address and the forwarding mechanism starts. The packet will appear in the forward chain. As the routing has already determined the target interface to be docker0, our OUT_FORWARD logging rule applies and the second log entry is produced, also confirming that the new target address is 172.17.0.2:80. Then, the jump to the DOCKER chain matches, and within that chain, the rule is accepted as its target port is 80.

Finally, the POSTROUTING chain in the NAT table is traversed. This produces our third log file entry. However, the SNAT rule does not apply, as the source address does not belong to the network 172.17.0.2/32 – you can use tcpdump on the bridge device to see that when the packet leaves the device, it still has the source IP address belonging to the diskstation. So again, the configuration works and we can reach an application inside the container from the outside world.

There are many other aspects of networking with Docker that I have not even touched upon – user defined bridges, overlay networks or the famous docker-proxy, just to mention a few fo them – but this post is already a bit lengthy, so let us stop here for today. I hope I could provide at least some insight into the internals of networking with Docker – and for me, this was actually a good opportunity to refresh and improve my still very basic knowledge of the Linux networking stack.

Docker internals: networking part I

In this post, we will investigate one of the more complex topics when working with Docker – networking.

We have already seen in the previous post that namespaces can be used to isolate networking resources used by different containers as well as resources used by containers from those used by the host system. However, by nature, networking is not only about isolating but also about connecting – how does this work?

So let us do some tests with the httpd:alpine image. First, get a copy of that image into your local repository:

$ docker pull httpd:alpine

Then open two terminals that we call Container1 and Container2 and attach to them (note that you need to switch to the second terminal after entering the second line).

$ docker run --rm -d  --name="Container1" httpd:alpine
$ docker exec -it Container1 "/bin/sh"

$ docker run --rm -d  --name="Container2" httpd:alpine
$ docker exec -it Container2 "/bin/sh"

Next, make curl available in both containers using apk update followed by apk add curl. Now let us switch to cointainer 1 and inspect the network configuration.

/usr/local/apache2 # ifconfig
eth0      Link encap:Ethernet  HWaddr 02:42:AC:11:00:02  
          inet addr:172.17.0.2  Bcast:172.17.255.255  Mask:255.255.0.0
          UP BROADCAST RUNNING MULTICAST  MTU:1500  Metric:1
          RX packets:1867 errors:0 dropped:0 overruns:0 frame:0
          TX packets:1017 errors:0 dropped:0 overruns:0 carrier:0
          collisions:0 txqueuelen:0 
          RX bytes:1831738 (1.7 MiB)  TX bytes:68475 (66.8 KiB)

lo        Link encap:Local Loopback  
          inet addr:127.0.0.1  Mask:255.0.0.0
          UP LOOPBACK RUNNING  MTU:65536  Metric:1
          RX packets:0 errors:0 dropped:0 overruns:0 frame:0
          TX packets:0 errors:0 dropped:0 overruns:0 carrier:0
          collisions:0 txqueuelen:1 
          RX bytes:0 (0.0 B)  TX bytes:0 (0.0 B)

We see that there is an ethernet interface eth0 with IP address 172.17.0.2. If you do the same in the second container, you should see a similar output with a different IP address, say 172.17.0.3.

Now let us make a few connection tests. First, go to the terminal running inside container 1 and enter

curl 172.17.0.3

You should now see a short HTML snippet containing the text “It works!”. So apparently we can reach container 2 from container 1 – and similarly, you should be able to reach container 1 from container 2. Finally, try the same from a terminal attached to the host – you should be able to reach both containers from there. Finally, if you also have a web server or a similar server running on the host, you will see that you can also reach that from within the containers. In my case, I have a running tomcat being bound to 0.0.0.0:8080 on my local host, and was able to connect using

curl 192.168.178.27:8080

from within the container. How does this work?

To solve the puzzle, go back to a terminal on the host system and take a look at the routing table.

$ ip route show
default via 192.168.178.1 dev enp4s0  proto static  metric 100 
169.254.0.0/16 dev enp4s0  scope link  metric 1000 
172.17.0.0/16 dev docker0  proto kernel  scope link  src 172.17.0.1 
192.168.178.0/24 dev enp4s0  proto kernel  scope link  src 192.168.178.27  metric 100 

We see that docker has apparently added an additional routing table entry and has created an additional networking device – docker0 – to which all packages with destination in the class B network 172.17.0.0 are sent.

This device is a so called bridge. A (software) bridge is very similar to an ethernet bridge in hardware. It connects two or more devices – each packet that goes to one device is forwarded to all other devices connected to the bridge. The Linux kernel offers the option to establish a bridge in software which does exactly the same thing.

Let us list all existing bridges using the brctl utility.

$ brctl show
bridge name	bridge id		STP enabled	interfaces
docker0		8000.0242fd67b17b	no		veth1f8d78c
							vetha1692e1

Let us compare this with the output of the ifconfig command (again on the host). The corresponding output is

veth1f8d78c Link encap:Ethernet  HWaddr 56:e5:92:e8:77:1e  
          inet6 addr: fe80::54e5:92ff:fee8:771e/64 Scope:Link
          UP BROADCAST RUNNING MULTICAST  MTU:1500  Metric:1
          RX packets:1034 errors:0 dropped:0 overruns:0 frame:0
          TX packets:1964 errors:0 dropped:0 overruns:0 carrier:0
          collisions:0 txqueuelen:0 
          RX bytes:70072 (70.0 KB)  TX bytes:1852757 (1.8 MB)

vetha1692e1 Link encap:Ethernet  HWaddr ca:73:3e:20:36:f7  
          inet6 addr: fe80::c873:3eff:fe20:36f7/64 Scope:Link
          UP BROADCAST RUNNING MULTICAST  MTU:1500  Metric:1
          RX packets:1133 errors:0 dropped:0 overruns:0 frame:0
          TX packets:2033 errors:0 dropped:0 overruns:0 carrier:0
          collisions:0 txqueuelen:0 
          RX bytes:78715 (78.7 KB)  TX bytes:1860499 (1.8 MB)

These two devices are also appearing in the output of brctl show and are two devices that are connected to the bridge. These devices are called a virtual ethernet devices. They are always created in pairs and act like a pipe: traffic flowing in at one of the two devices appears to come out of the second device and vice versa – like a virtual network cable connecting the two devices.

We just said that virtual devices are always created in pairs. We have two containers, and if you start them one by one and look at the output of ifconfig, we see that each of the two containers contributes one device. Can that be correct? After starting the first container we should already see a pair, and after starting the second one we should see four instead of just two devices. So one in each pair is missing. Where did it go?

The answer is that Docker did create it, but move it into the namespace of the container, so that it is no longer visible on the host. To verify this, we can see the connection between the two interfaces as follows. First, enter

ip link

on the host. The output should look similar to the following lines

$ ip link
1: lo:  mtu 65536 qdisc noqueue state UNKNOWN mode DEFAULT group default qlen 1
    link/loopback 00:00:00:00:00:00 brd 00:00:00:00:00:00
2: enp4s0:  mtu 1500 qdisc pfifo_fast state UP mode DEFAULT group default qlen 1000
    link/ether 1c:6f:65:c0:c9:85 brd ff:ff:ff:ff:ff:ff
3: docker0:  mtu 1500 qdisc noqueue state UP mode DEFAULT group default 
    link/ether 02:42:fd:67:b1:7b brd ff:ff:ff:ff:ff:ff
25: vetha1692e1@if24:  mtu 1500 qdisc noqueue master docker0 state UP mode DEFAULT group default 
    link/ether ca:73:3e:20:36:f7 brd ff:ff:ff:ff:ff:ff link-netnsid 0
27: veth1f8d78c@if26:  mtu 1500 qdisc noqueue master docker0 state UP mode DEFAULT group default 
    link/ether 56:e5:92:e8:77:1e brd ff:ff:ff:ff:ff:ff link-netnsid 1

This will show you (the very first number in each line) the so called ifindex which is a unique identifier for each network device within the kernel. In our case, the virtual ethernet devices visible in the host namespace have the indices 25 and 27. After each name, after the “at” symbol, you see a second number – 24 and 26. Now let us execute the same commmand in the first container.

/usr/local/apache2 # ip link
1: lo:  mtu 65536 qdisc noqueue state UNKNOWN qlen 1
    link/loopback 00:00:00:00:00:00 brd 00:00:00:00:00:00
24: eth0@if25:  mtu 1500 qdisc noqueue state UP 
    link/ether 02:42:ac:11:00:02 brd ff:ff:ff:ff:ff:ff

Here suddenly the device with index 24 appears, and we see that it is connected to device if25, which is displayed as vetha1692e1 in the host namespace! Similarly, we find the device if26 inside container two:

/usr/local/apache2 # ip link
1: lo:  mtu 65536 qdisc noqueue state UNKNOWN qlen 1
    link/loopback 00:00:00:00:00:00 brd 00:00:00:00:00:00
26: eth0@if27:  mtu 1500 qdisc noqueue state UP 
    link/ether 02:42:ac:11:00:03 brd ff:ff:ff:ff:ff:ff

This gives us now a rather complete picture of the involved devices. Ignoring the loopback devices for a moment, the following picture emerges.

dockernetworking.png

Now we can understand what happens when an application in container 1 sends a packet to container 2. First, the kernel will inspect the routing table in container 1. This table looks as follows.

/usr/local/apache2 # ip route
default via 172.17.0.1 dev eth0 
172.17.0.0/16 dev eth0  src 172.17.0.2

So the kernel will determine that the packet should be sent to the interface known as eth0 in container 1 – this is the interface with the unique index 24. As this is part of a virtual ethernet device pair, it appears on the other side of the pair, i.e. at the device vetha1692e1. This device in turn is connected to the bridge docker0. Being a bridge, it will distribute the packet to all other attached devices, so it will reach veth1f8d78c. This is now one endpoint of the second virtual ethernet device pair, and so the packet will finally end up at the interface with the unique index 26, i.e. the interface that is called eth0 in container 2. On this interface, the HTTP daemon is listening, receives the message, prepares an answer and that answer goes the same way back to container 1.

Thus, effectively, it appears from inside the containers as if all container network interfaces would be attached to the same network segment. To complete the picture, we can actually follow the trace of a packet going from container 1 to container 2 using arp and traceroute.

/usr/local/apache2 # arp
? (172.17.0.1) at 02:42:fd:67:b1:7b [ether]  on eth0
? (172.17.0.3) at 02:42:ac:11:00:03 [ether]  on eth0
/usr/local/apache2 # traceroute 172.17.0.3
traceroute to 172.17.0.3 (172.17.0.3), 30 hops max, 46 byte packets
 1  172.17.0.3 (172.17.0.3)  0.016 ms  0.013 ms  0.010 ms

We can now understand how applications in different containers can communicate with each other. However, what we have discussed so far is not yet sufficient to explain how an application on the host can access a HTTP server running inside a container, and what additional setup we need to access a HTTP server running in a container from the LAN. This will be the topic of my next post.


Setting up and testing our bitcoin network

In the last post in my series on bitcoin and the blockchain, we have successfully “dockerized” the bitcoin core reference implementation and have built the bitcoin-alpine docker container that contains a bitcoin server node on top of the Alpine Linux distribution. In this post, we will use this container image to build up and initialize a small network with three nodes.

First, we start a node that will represent the user Alice and manage her wallet.

$ docker run -it --name="alice" -h="alice" bitcoin-alpine

Note that we have started the container with the option -it so that it stays attached to the current terminal and we can see its output. Let us call this terminal terminal 1. We can now open a second terminal and attach to the running server and use the bitcoin CLI to verify that our server is running properly.

$ docker exec -it alice  "sh"
# bitcoin-cli -regtest --rpcuser=user --rpcpassword=password getinfo

If you run – as shown above – the bitcoin CLI inside the container using the getbalance RPC call, you will find that at this point, the balance is still zero. This not surprising, our network does not contain any bitcoins yet. To create bitcoins, we will now bring up a miner node and mine a certain amount of bitcoin. So in a third terminal, enter

$ docker run -it --name="miner" -h="miner" bitcoin-alpine

This will create a second node called miner and start a second instance of the bitcoin server within this network. Now, however, our two nodes are not yet connected. To change this, we can use the addnode command in the bitcoin CLI. So let us figure out how they can reach each other on the network. We have started both containers without any explicit networking options, so they will be connected to the default bridge network that Docker creates on your host. To figure out the IP addresses, run

$ docker network inspect bridge

on your host. This should produce a list of network devices in JSON format and spit out the IP addresses of the two nodes. In my case, the node alice has the IP address 172.17.0.2 and the miner has the IP address 172.17.0.3. So let us change back to terminal number 2 (attached to the container alice) and run

# bitcoin-cli -regtest --rpcuser=user --rpcpassword=password addnode 172.17.0.3 add

In the two terminal windows that are displaying the output of the two bitcoin daemons on the nodes alice and miner, you should now see an output similar to the following.

2018-03-24 14:45:38 receive version message: /Satoshi:0.15.0/: version 70015, blocks=0, us=[::]:0, peer=0

This tells you that the two peers have exchanged a version message and recognized each other. Now let us mine a few bitcoins. First attach a terminal to the miner node – this will be terminal four.

$ docker exec -it miner "sh"

In that shell, enter the following command

# bitcoin-cli -regtest --rpcuser=user --rpcpassword=password generate 101
# bitcoin-cli -regtest --rpcuser=user --rpcpassword=password getbalance

You should now see a balance of 50 bitcoins. So we have mined 50 bitcoins (in fact, we have mined much more, but it requires additional 100 blocks before a mined transaction is considered to be part of the balance and therefore only the amount of 50 bitcoins corresponding to the very first block shows up).

This is already nice, but when you execute the RPC method getbalance in terminal two, you will still find that Alice balance is zero – which is not surprising, after all the bitcoins created so far have been credited to the miner, not to Alice. To change this, we will now transfer 30 bitcoin to Alice. As a first step, we need to figure out what Alice address is. Each wallet maintains a default account, but we can add as many accounts as we like. So let us now add an account called “Alice” on the alice node. Execute the following command in terminal two which is attached to the container alice.

# bitcoin-cli -regtest --rpcuser=user --rpcpassword=password getnewaddress "Alice"

The output should be something like mkvAYmgqrEFEsJ9zGBi9Z87gP5rGNAu2mx which is the bitcoin address that the wallet has created. Of course you will get a different address, as the private key behind that address will be chosen randomly by the wallet. Now switch to the terminal attached to the miner node (terminal four). We will now transfer 30 bitcoin from this node to the newly created address of Alice.

# bitcoin-cli -regtest --rpcuser=user --rpcpassword=password sendtoaddress "mkvAYmgqrEFEsJ9zGBi9Z87gP5rGNAu2mx" 30.0

The output will be the transaction ID of the newly created transaction, in my case this was

2bade389ac5b3feabcdd898b8e437c1d464987b6ac1170a06fcb24ecb24986a8

If you now display the balances on both nodes again, you will see that the balance in the default account on the miner node has dropped to something a bit below 20 (not exactly 20, because the wallet has added a fee to the transaction). The balance of Alice, however, is still zero. The reason is that the transaction does not yet count as confirmed. To confirm it, we need to mine six additional blocks. So let us switch to the miners terminal once more and enter

# bitcoin-cli -regtest --rpcuser=user --rpcpassword=password generate 6

If you now display the balance on the node alice, you should find that the balance is now 30.

Congratulations – our setup is complete, we have run our first transaction and now have plenty of bitcoin in a known address that we can use. To preserve this wonderful state of the world, we will now create two new images that contain snapshots of the nodes so that we have a clearly defined state to which we can always return when we run some tests and mess up our test data. So switch back to a terminal on your host and enter the following four commands.

$ docker stop miner
$ docker stop alice
$ docker commit miner miner
$ docker commit alice alice

If you now list the available images using docker images, you should see two new images alice and miner. If you want, you can now remove the stopped container instances using docker rm.

Now let us see how we can talk to a running server in Python. For that purpose, let us start a detached container using our brand new alice image.

$ docker run  -d --rm --name=alice -p 18332:18332 alice

We can now communicate with the server using RPC requests. The bitcoin RPC interface follows the JSON RPC standard. Using the powerful Python package requests, it is not difficult to write a short function that submits a request and interprets the result.

def rpcCall(method, params = None, port=18332, host="localhost", user="user", password="password"):
    #
    # Create request header
    #
    headers = {'content-type': 'application/json'}
    #
    # Build URL from host and port information
    #
    url = "http://" + host + ":" + str(port)
    #
    # Assemble payload as a Python dictionary
    # 
    payload = {"method": method, "params": params, "jsonrpc": "2.0", "id": 1}        
    #
    # Create and send POST request
    #
    r = requests.post(url, json=payload, headers=headers, auth=(user, password))
    #
    # and interpret result
    #
    json = r.json()
    if 'result' in json and json['result'] != None:
        return json['result']
    elif 'error' in json:
        raise ConnectionError("Request failed with RPC error", json['error'])
    else:
        raise ConnectionError("Request failed with HTTP status code ", r.status_code)

If have added this function to my btc bitcoin library within the module utils. We can use this function in a Python program or an interactive ipython session similar to the bitcoin CLI client. The following ipython session demonstrates a few calls, assuming that you have cloned the repository.

In [1]: import btc.utils
In [2]: r = btc.utils.rpcCall("listaccounts")
In [3]: r
Out[3]: {'': 0.0, 'Alice': 30.0}
In [4]: r = btc.utils.rpcCall("dumpprivkey", ["mkvAYmgqrEFEsJ9zGBi9Z87gP5rGNAu2mx"])
In [5]: r
Out[5]: 'cQowgjRpUocje98dhJrondLbHNmgJgAFKdUJjCTtd3VeMfWeaHh7'

We are now able to start our test network at any time from the saved docker images and communicate with it using RPC calls in Python. In the next post, we will see how a transaction is created, signed and propagated into the test network.

Docker internals: process isolation with namespaces and cgroups

A couple of years back, when I first looked into Docker in more detail, I put together a few pages on how Docker is utilizing some Linux kernel technologies to realize process isolation. Recently I have been using Docker again, so I thought it would be a good point in time to dig out some of that and create two or maybe three posts on some Docker internals. Lets get started….

Container versus virtual machines

You probably have seen the image below or a similar image before, but for the sake of completeness let us quickly recap what the main difference between a container like Docker and a virtual machine is.

DockerVsVirtualMachine

On the left hand side, we see a typical stack when full virtualization is used. The exact setup will depend on the virtualization model that is being used, but in many cases (like running VirtualBox on Linux), you will have the actual hardware, a host operating system like Linux that consists of the OS kernel and on top of that a file system, libraries, configuration files etc. On these layers, the virtual machine is executing as an application. Inside the virtual machine, the guest OS is running. This could again be Linux, but could be a different distribution, a different kernel or even a completely different operating system. Inside each virtual machine, we then again have an operating kernel system kernel, all required libraries and finally the applications.

This is great for many purposes, but also introduces some overhead. If you decide to slice and dice your applications into small units like microservices, your actual applications can be rather small. However, for every application, you still need the overhead of a full operating system. In addition, a full virtualization will typically also consume a few resources on the host system. So full virtualization might not always be the perfect solution.

Enter containers. In a container solution, there is only one kernel – in fact, all containers and the applications running in them use the same kernel, namely the kernel of the host OS. At least logically, however, they all have their own root file system, libraries and so on. Thus containers still have the benefit of a certain isolation, i.e. different applications running in different container are still isolated on the file system level, can use networking resources like ports and sockets without conflicting and so forth, while reducing the overhead by sharing the kernel. This makes containers a good choice if you can live with the fact that all applications run one one OS and kernel version.

But how exactly does the isolation work? How does a container create the illusion for a process running inside it that it is the exclusive user of the host operating system? It turns out that Docker uses some technologies built into the Linux kernel to do this. Let us take a closer look at those core technologies one by one.

Core technologies

Let us start with namespaces. If you know one or more programming languages, you have probably heard that term before – variables and other objects are assigned to namespaces so that a module can use a variable x without interfering with a variable of the same name in a different module. So namespaces are about isolation, and that is also their role in the container world.

Let us look at an example to understand this. Suppose you want to run a web server inside a container. Most web servers will try to bind to port 80 on startup. Now at any point in time, only one application can listen on that port (with the same IP address). So if you start two containers that both run a web server, you need a mechanism to make sure that both web servers can – inside their respective container – bind to port 80 without a conflict.

A similar issue exists for process IDs. In the “good old days”, a Linux process was uniquely identified by its process ID, so there was exactly one process with ID 1 – usually the init process. ID 1 is a bit special, for instance when it comes to signal handling, and usually different copies of the user space OS running in different containers will all try to start their own init process and might rely on it having process ID one. So again, there is a clash of resources and we need some magic to separate them between containers.

That is exactly what Linux namespaces can do for you. Citing from the man page,

A namespace wraps a global system resource in an abstraction that makes it appear to the processes within the namespace that they have their own isolated instance of the global resource.

In fact, Linux offers namespaces for different types of resources – networking resources, but also mount points, process trees or the good old System V inter-process communication devices. Individual processes can join a namespace or leave a namespace. If you spawn a new process using the clone system call, you can either ask the kernel to assign the new process to the same namespaces as the parent process, or you can create new namespaces for the child process.

Linux exposes the existing namespaces as symbolic links in the directory /proc/XXXX/ns, where XXXX is the process id of the respective process. Let us try this out. In a terminal, enter (recall that $$ expands to the PID of the current process)

$ ls -l /proc/$$/ns
total 0
lrwxrwxrwx 1 chr chr 0 Apr  9 09:36 cgroup -> cgroup:[4026531835]
lrwxrwxrwx 1 chr chr 0 Apr  9 09:36 ipc -> ipc:[4026531839]
lrwxrwxrwx 1 chr chr 0 Apr  9 09:36 mnt -> mnt:[4026531840]
lrwxrwxrwx 1 chr chr 0 Apr  9 09:36 net -> net:[4026531957]
lrwxrwxrwx 1 chr chr 0 Apr  9 09:36 pid -> pid:[4026531836]
lrwxrwxrwx 1 chr chr 0 Apr  9 09:36 user -> user:[4026531837]
lrwxrwxrwx 1 chr chr 0 Apr  9 09:36 uts -> uts:[4026531838]

Here you see that each namespace to which the process is assigned is represented by a symbolic link in this directory (you could use ls -Li to resolve the link and display the actual inode to which it is pointing). If you compare this with the content of /proc/1/ns (you will need to be root to do this), you will probably find that the inodes are the same, so your shell lives in the same namespace as the init process. We will later see how this changes when you run a shell inside a container.

Namespaces already provide a great deal of isolation. There is one namespace, the mount namespace, which even allows different processes to mount different volumes as root directory, and we will later see how Docker uses this to realize file system isolation. Now, if every container really had its own, fully, independent root file system, this would again introduce a high overhead. If, for instance, you run two containers that both use Ubuntu Linux 16.04, a large part of the root file system will be identical and therefore duplicated.

To be more efficient, Docker therefore uses a so called layered file system or union mount. The idea behind this is to merge different volumes into one logical view. Suppose, for instance, that you have a volume containing a file /fileA and another volume containing a file /fileB. With a traditional mount, you could mount any of these volumes and would then see either file A or file B. With a union mount, you can mount both volumes and would see both files.

That sounds easy, but is in fact quite complex. What happens, for instance, if both volumes contain a file called /fileA? To make this work, you have to add layers, where each layer will overlay files that already exist in lower layers. So your mounts will start to form a stack of layers, and it turns out that this is exactly what we need to efficiently store container images.

To understand this, let us again look at an example. Suppose you run two containers which are both based on the same image. What then essentially happens is that Docker will create two union mounts for you. The lowest layer in both mounts will be identical – it will simply be the common image. The second layer, however, is specific to the respective container. When you now add or modify a file in one container, this operation changes only the layer specific to this container. The files which are not modified in any of the containers continue to be stored in the common base layer. Thus, unless you execute heavy write operations in the container, the specific layers will be comparatively small, reducing the overhead greatly. We will see this in action soon.

Finally, the last ingredient that we need are control groups, abbreviated as cgroups. Essentially, cgroups provide a way to organize Linux processes into hierarchies in order to manage resource limits. Being hierarchies, cgrous are again exposed as part of the file system. On my machine, this looks as follows.

chr:~$ ls /sys/fs/cgroup/
blkio  cpu  cpuacct  cpu,cpuacct  cpuset  devices  freezer  hugetlb  memory  net_cls  net_cls,net_prio  net_prio  perf_event  pids  systemd

We can see that there are several directories, each representing a specific type of resources that we might want to manage. Each of these directories can contain an entire file system tree, where each directory represents a node in the hierarchy. Processed can be assigned to a node by adding their process ID to the file tasks that will find in each of these nodes. Again, the man page turns out to be a helpful resource and explains the meaning of the different entries in the /sys/fs/cgroup directories.

Practice

Let us now see how all this works in practice. For that purpose, let us open two terminals. In one of the terminals – let me call this the container terminal – start a container running the Alpine distribution using

docker run --rm -it alpine

In the second window which I will call the host window, we can now use ps -axf to inspect the process tree and then look at the directories in /proc to browse the namespaces.

What you will find is that there are three processes involved. First, there is the docker daemon itself, called dockerd. In my case, this process has PID 1496. Then, there is a child process called docker-containerd, which is the actual container runtime within the Docker architecture stack. This process in turn calls a process called docker-containerd-shim (PID 10126) which then spawns the shell (PID 10142 in my case) inside the container.

ProcessTree


Now let us inspect the namespaces associated with these processes first. We start with the shell itself.

$ sudo ls -Lil /proc/10142/ns
total 0
4026531835 -r--r--r-- 1 root root 0 Apr  9 11:20 cgroup
4026532642 -r--r--r-- 1 root root 0 Apr  9 11:20 ipc
4026532640 -r--r--r-- 1 root root 0 Apr  9 11:20 mnt
4026532645 -r--r--r-- 1 root root 0 Apr  9 10:48 net
4026532643 -r--r--r-- 1 root root 0 Apr  9 11:20 pid
4026531837 -r--r--r-- 1 root root 0 Apr  9 11:20 user
4026532641 -r--r--r-- 1 root root 0 Apr  9 11:20 uts

Let us now compare this with the namespaces to which the containerd-shim process is assigned.

$ sudo ls -Lil /proc/10126/ns
total 0
4026531835 -r--r--r-- 1 root root 0 Apr  9 11:21 cgroup
4026531839 -r--r--r-- 1 root root 0 Apr  9 11:21 ipc
4026531840 -r--r--r-- 1 root root 0 Apr  9 11:21 mnt
4026531957 -r--r--r-- 1 root root 0 Apr  9 08:49 net
4026531836 -r--r--r-- 1 root root 0 Apr  9 11:21 pid
4026531837 -r--r--r-- 1 root root 0 Apr  9 11:21 user
4026531838 -r--r--r-- 1 root root 0 Apr  9 11:21 uts

We see that Docker did in fact create new namespaces for almost all possible namespaces (ipc, mnt, net, pid, uts).

Next, let us compare mount points. Inside the cointainer, run mount to see the existing mount points. Usually at the very top of the output, you should see the mount for the root filesystem. In my case, this was

none on / type aufs (rw,relatime,si=e92adf256343919e,dio,dirperm1)

Running the same command on the host system, I got a line like

none on /var/lib/docker/aufs/mnt/a9c5d26a45307d4e168b3936bd65d301c8dd039336083a324ed1a0b7c2bd0c52 type aufs (rw,relatime,si=e92adf256343919e,dio,dirperm1)

The identical si attribute tells you that this is fact the same mount. You also verify this directly. Inside the container, create a file test using touch test. If you then use ls to display the contents of the mount point as seen on the host, you should actually see this file. So the host process and the process inside the container see different mount points – made possible by the namespace technology! You can now access the files from inside the container or from outside the container without having to use docker exec (though I am note sure I would recommend this).

If you want, you can even trace the individual layers of this file system on the host system by using ls /sys/fs/aufs/si_e92adf256343919e/ and printing out the contents of the various files that you will find there – you will find that there are in fact two layers, one of them being a read-only layer and the second on top being a read-write layer.

ls /sys/fs/aufs/si_e92adf256343919e/
br0  br1  br2  brid0  brid1  brid2  xi_path
root:~# cat /sys/fs/aufs/si_e92adf256343919e/xi_path
/dev/shm/aufs.xino
root:~# cat /sys/fs/aufs/si_e92adf256343919e/br0
/var/lib/docker/aufs/diff/a9c5d26a45307d4e168b3936bd65d301c8dd039336083a324ed1a0b7c2bd0c52=rw
root:~# cat /sys/fs/aufs/si_e92adf256343919e/br1
/var/lib/docker/aufs/diff/a9c5d26a45307d4e168b3936bd65d301c8dd039336083a324ed1a0b7c2bd0c52-init=ro+wh

You can even “enter the container” using the nsenter Linux command to manually attach to defined namespaces of a process. To see this, enter

$ sudo nsenter -t 10142 -m -p -u "/bin/sh"
/ # ls
bin    dev    etc    home   lib    media  mnt    proc   root   run    sbin   srv    sys    test   tmp    usr    var
/ #

in a host terminal. This will attach to the mount, PID and user namespaces of the target process specified via the -t parameter, in our case this is the PID of the shell inside the container, and run the specified command /bin/sh. As a result, you will now see the file test created inside the container and see the same filesystem that is also visible inside the container.

Finally, let us take a look at the cgroups docker has created for this container. The easiest way to find them is to search for the first few characters of the container ID that you can figure out using docker ps (I have cut off some lines at the end of the output).

$ docker ps
CONTAINER ID        IMAGE               COMMAND             CREATED             STATUS              PORTS               NAMES
7c0f142bfbfd        alpine              "/bin/sh"           About an hour ago   Up About an hour                        quizzical_jones
$ find /sys/fs/cgroup/ -name "*7c0f142bfbfd*"
/sys/fs/cgroup/pids/docker/7c0f142bfbfdb9320166f92d17ecbf9d462e9c234916632f23ec1b454fb6eb52
/sys/fs/cgroup/pids/system.slice/var-lib-docker-containers-7c0f142bfbfdb9320166f92d17ecbf9d462e9c234916632f23ec1b454fb6eb52-shm.mount
/sys/fs/cgroup/freezer/docker/7c0f142bfbfdb9320166f92d17ecbf9d462e9c234916632f23ec1b454fb6eb52
/sys/fs/cgroup/net_cls,net_prio/docker/7c0f142bfbfdb9320166f92d17ecbf9d462e9c234916632f23ec1b454fb6eb52
/sys/fs/cgroup/cpuset/docker/7c0f142bfbfdb9320166f92d17ecbf9d462e9c234916632f23ec1b454fb6eb52

If you now inspect the task files in each of the newly created directories, you will find the PID of the container shell as seen from the root namespace, i.e. 10142 in this case.

This closes this post which is already a bit lengthy. We have seen how Docker uses union file systems, namespaces and cgroups to manage and isolate container and how we can link the resources as seen from within the container to resources on the host system. In the next posts, we will look in more detail at networking in Docker. Until then, you might want to consult the followings links that contain additional material.

  • J. Pettazone has put slides from a talk online
  • The overview from the official Docker documentation briefly explains the core technologies
  • There are of course already many excellent blog posts on Docker internals, like the one by Julia Evans
  • The post from the Docker Saigon community

In case you are interested in container platforms in general, you also might want to take a look at my series on Kubernetes that I have just started.